Dyeing Process Monitoring: Curves, Batches, Traceability
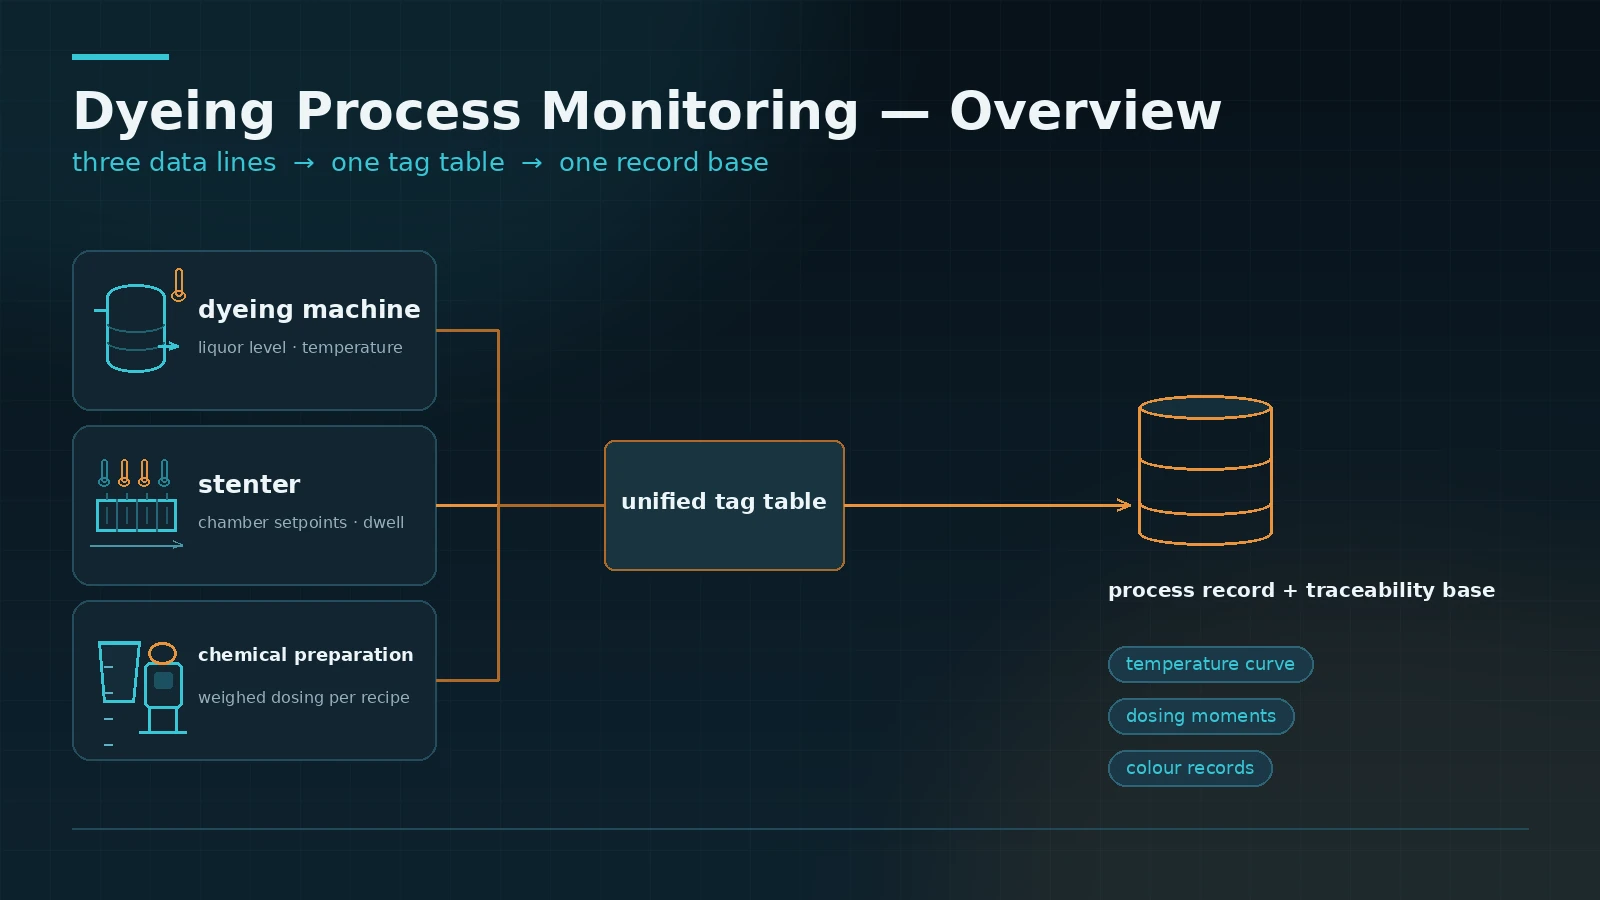
A dyeing process monitoring system is the supervisory and data layer of a dyehouse: it records dyeing machine temperature and dosing curves, stenter zone temperatures and line speed, and preparation weighing and colour difference on one common timeline, so the process conditions of each lot can be reviewed and compared afterwards. The hard part of a shade rework or a batch dispute is usually not the absence of data but that the data sits in local panels, shift notebooks and laboratory spreadsheets that never meet on one timeline. This article covers what each of the three data lines has to capture, which definitions to fix before go-live, how batch cards and lot numbers form a traceability chain, and the acceptance points of a staged rollout.
1. What a dyeing process monitoring system covers: three data lines
A dyeing process monitoring system is the supervisory and data layer of a dyehouse. It records three groups of process parameters on one common timeline: the dyeing machine (batch number, liquor ratio, heating and cooling curve, dosing sequence, pH), the stenter (temperature per zone, line speed, overfeed, exhaust humidity) and the chemical preparation and laboratory area (dye and auxiliary weighing, stock liquor concentration, colour difference of lab dips). Once these three lines sit on the same timeline, the process conditions of a single dye lot can be reconstructed in full instead of being pieced together from shift notebooks.
The difference from the local control panel is retention and comparison. A local panel serves the current shift, and once a setpoint has been changed the change history is hard to recover. A monitoring system samples on a fixed cycle and archives the values, so curves from the same article on different shifts and different machines can be overlaid directly. When a shade has to be reworked, being able to pull up the original heating curve and the dosing moments is a different starting point from holding a handwritten process card.
Field interfaces are rarely uniform. Newer dyeing machines and stenters usually offer an Ethernet port with Modbus TCP or OPC UA (IEC 62541); older machines often have only an RS485 serial port running a vendor protocol or Modbus RTU; preparation and weighing equipment commonly exposes a weighing indicator over serial. The monitoring system has to support these channels under one tag table and store raw values, engineering values and equipment status bits separately, so that a range change in one place does not corrupt the historical curves.
2. Definitions to fix before go-live: liquor ratio, ramps and energy units
On two dyeing machines from different suppliers, the same liquor ratio may be expressed in completely different ways: a level in millimetres, a main pump frequency, or a calculated ratio. If these definitions are not aligned before go-live, every later comparison is distorted. Confirm them signal class by signal class, and write the conclusions into the scope document.
| Signal class | What to confirm | Common problem |
|---|---|---|
| Temperature curve | Sensor location (in-liquor or heat exchanger outlet), sampling cycle, unit of ramp rate | Only the programmed setpoint is recorded, not the measured value, so deviation cannot be judged |
| Liquor ratio and level | Level sensor type and range, source of fabric weight, whether the ratio is calculated or set | Fabric weight is entered by hand and the ratio does not match reality |
| Dosing and preparation | Dosing moment, unit of quantity (kg, L or percent), whether stock concentration is recorded | Only the recipe ID is stored, so a revision cannot be reproduced |
| Stenter temperature | Number and position of sensors per zone, unit of line speed, definition of overfeed | One sensor per zone, so a side-to-side shade difference has no traceable source |
| Steam and water | Meter type, unit of measure (kg or cubic metres), whether allocated per lot or per shift | Mixed units (tonnes and kilograms) make specific consumption impossible to compute |
| Colour difference and inspection | Colour difference formula and illuminant (for example CIELAB ΔE*ab, D65), sampling position | Only pass or fail is recorded without the value, so no trend is visible |
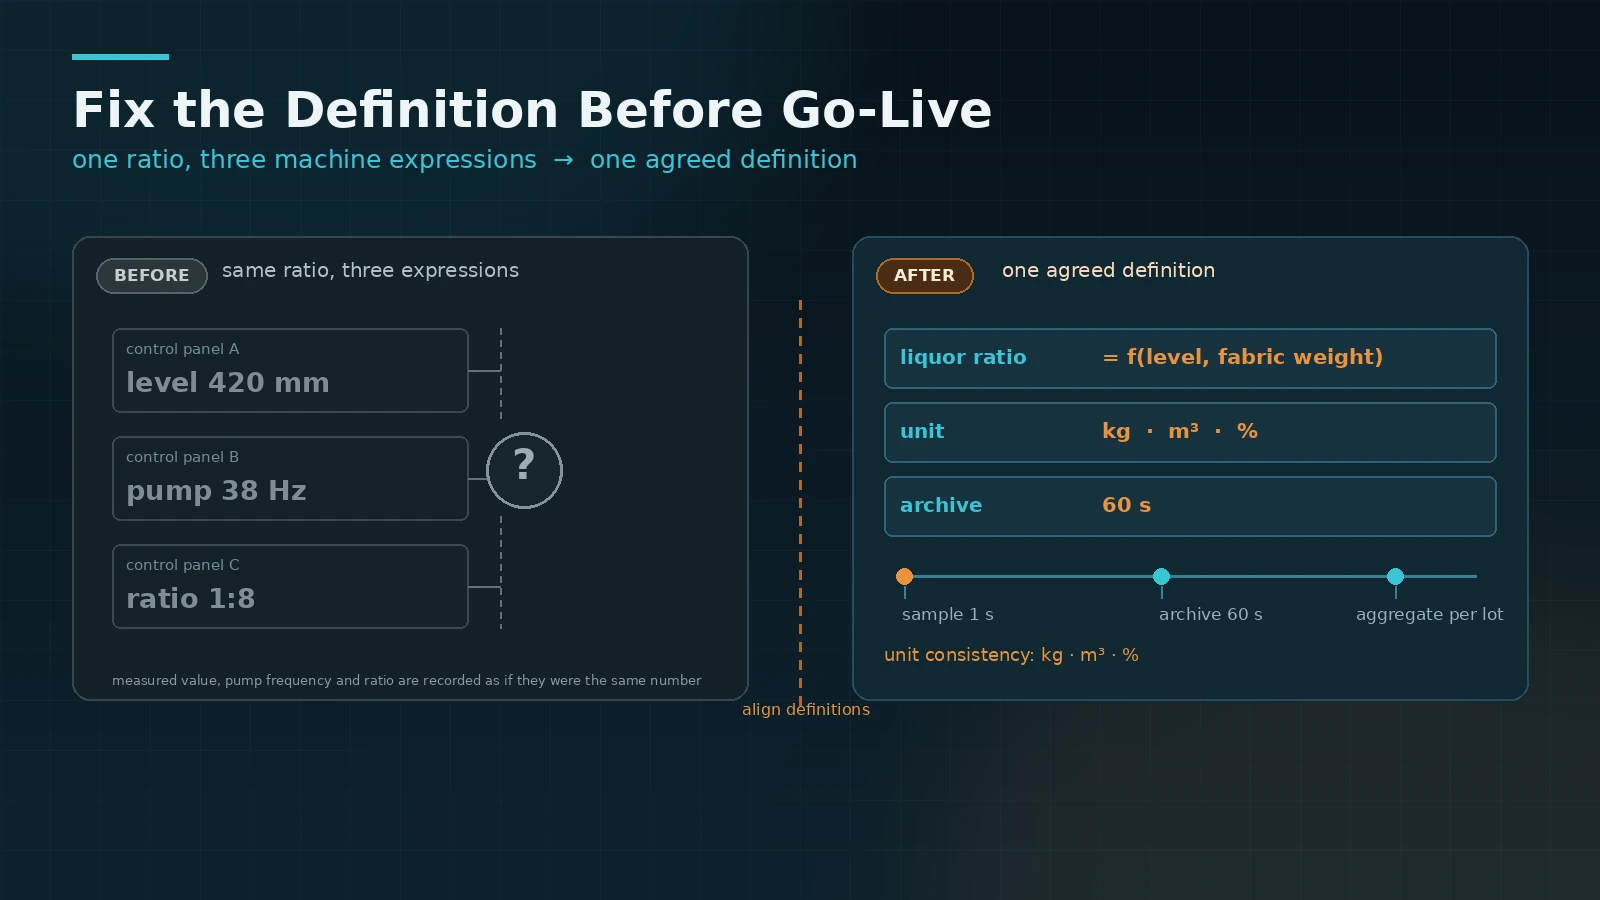
Sampling and archiving strategy should be fixed together with the definitions. Temperature and pressure are typically sampled per second and archived per minute; dosing and valve movements are recorded on change; output, steam, water and electricity are aggregated per lot or per shift. The archiving strategy has to answer two questions: can a complete curve of a lot from three months ago still be retrieved, and how much storage does one lot consume. The first sets the retention period, the second sets the storage and backup budget.
3. How batch cards, lot numbers and colour records form a traceability chain
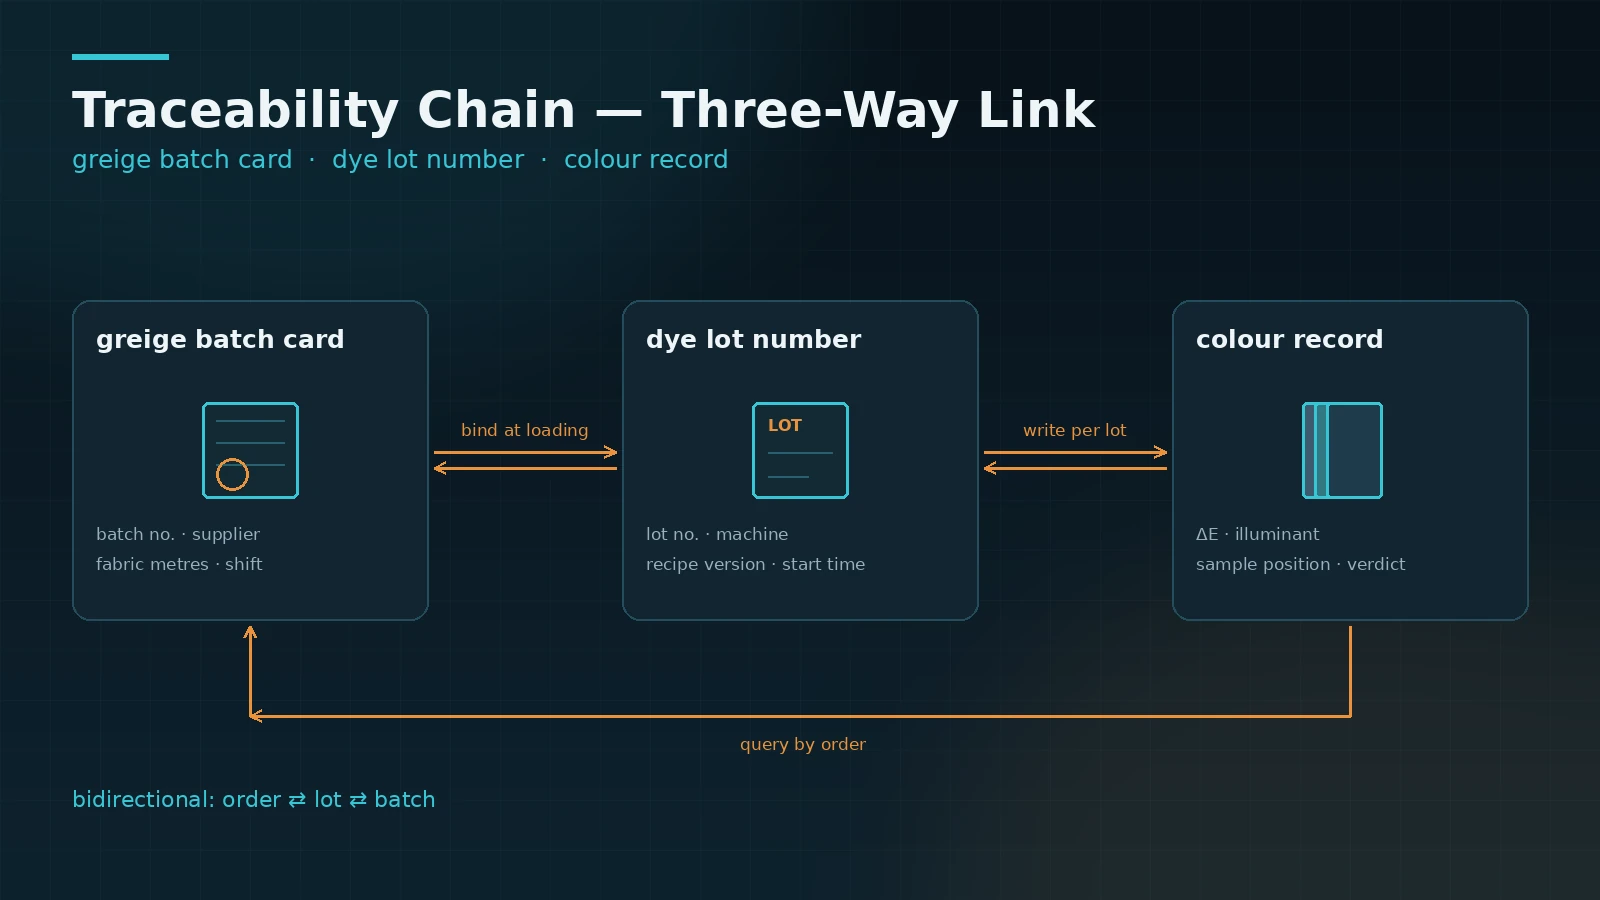
Traceability in a dyehouse differs from assembly: one dye lot may draw on several greige fabric batches, and the resulting fabric is later split across several orders. The chain has to work in both directions, from a finished order back to the dye lot and the greige batches, and from a greige batch forward to the orders it went into.
- Batch card: record the batch number, supplier and metres at greige goods receipt, then bind the card number to the dye lot at loading. When one lot draws on several batches, register all of them, not only the main one.
- Lot number and process curve: the dye lot is the primary key of the dyeing process. Curves, dosing records, operator and time all hang off it, and re-use of lot numbers needs an explicit cycle and release rule.
- Colour records: record lab dip, lot-to-lot and final inspection values under one formula and illuminant, with the sampling position noted, so that within-lot and between-lot variation can be told apart.
- Rework and reprocessing: a rework must create a new processing record linked to the original lot, so that the rework curve does not overwrite the original.
- Finished goods and orders: bind inspection results to order number, lot number and metres, so that shipment can be traced back to every lot involved.
The item most often skipped is registering multiple batches per lot. Under schedule pressure only the main batch is entered, and the remaining batches drop out of the chain. If a customer later questions a whole shipment, what remains is an approximate time window.
4. Staged rollout and acceptance points
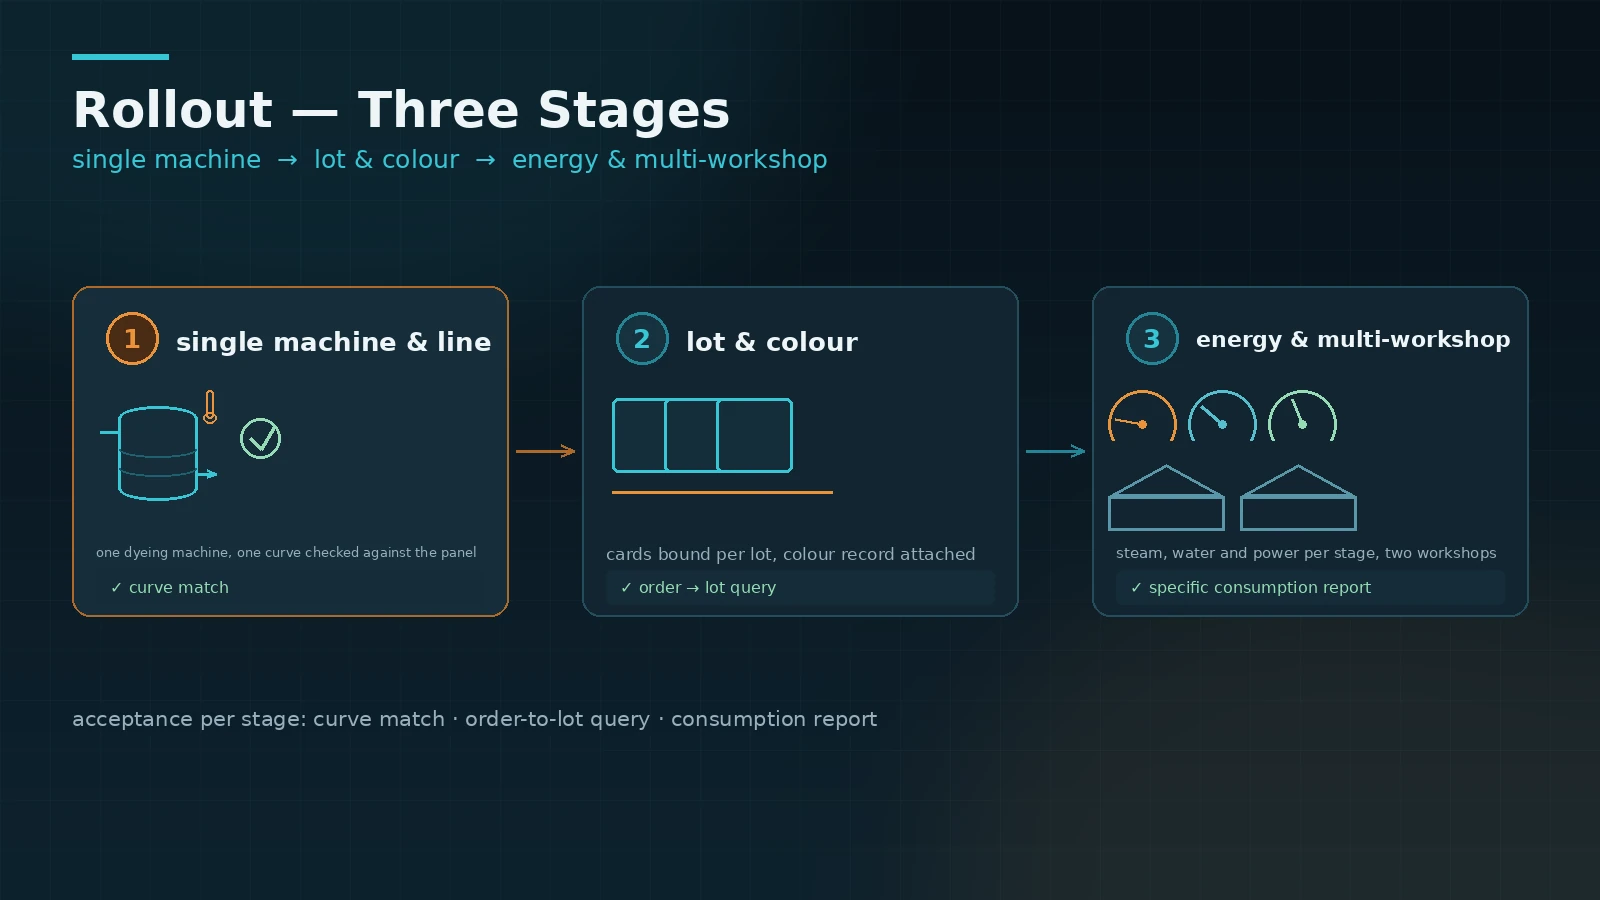
Dyehouses run a wide mix of machine models and a dense batch sequence, so connecting the whole plant at once is rarely realistic. A more controllable path is to take one line or one workshop, get the dyeing machine curves and lot binding working, then extend to stenters and energy metering.
- Stage 1, single machine and line: the goal is that key parameters are continuously archived and the curve values match the local panel. Acceptance samples a number of lots and checks the completeness of temperature, liquor ratio and dosing moments, plus timestamp continuity.
- Stage 2, batch and colour traceability: batch cards, lot numbers and colour records start working together, so an order can be traced back to its lots and a lot can pull up both curves and inspection results.
- Stage 3, energy and multiple workshops: steam, water and electricity are allocated per lot or per shift, specific consumption enters routine reporting, and the validated tag tables and report templates are replicated to other workshops.
The measure is not how many tags are connected, but whether the workshop opens the curves first when a shade problem or a rework appears. Until that happens, connectivity alone remains connectivity.
Conclusion: agree the definitions before counting machines
The value of a dyeing process monitoring system is not the number of machines connected, but whether the definitions of temperature curve, liquor ratio and energy use were settled in advance and whether batch cards and lot numbers line up when someone actually traces a lot. Once those three things hold, the workshop will open the curves first when a shade problem or a rework appears; before that, more screens only move the local panel onto a different display. For a dyehouse, getting curves and lot binding working in one workshop and then extending to stenters and metering is usually more controllable than connecting the whole plant at once.
Book a solution discussion
If you are evaluating a dyeing process monitoring system, or want to review the signal definitions and batch traceability requirements of your existing dyeing machines and stenters first, contact us to discuss site conditions and a sensible sequence. We will work from your machine types, communication interfaces and process record requirements to propose an executable approach.
Contact Us