SPC Statistical Process Control System: Charts and Rules
An SPC statistical process control system plots each batch of measurement data in time order on control charts so a process signals trouble before it starts producing defects. It does not track how many defects were already made; it tracks whether the numeric distribution of a process has started to shift, and in which direction and at what speed. Getting SPC to work comes down to three things: capturing measurement data reliably, choosing the right control charts and alert rules, and connecting process capability to improvement actions. This article covers the main data capture paths, how to select control charts and alert rules, how to read capability indices, alarm response and closure, the boundaries with MES and inspection equipment, and a staged rollout with acceptance points.
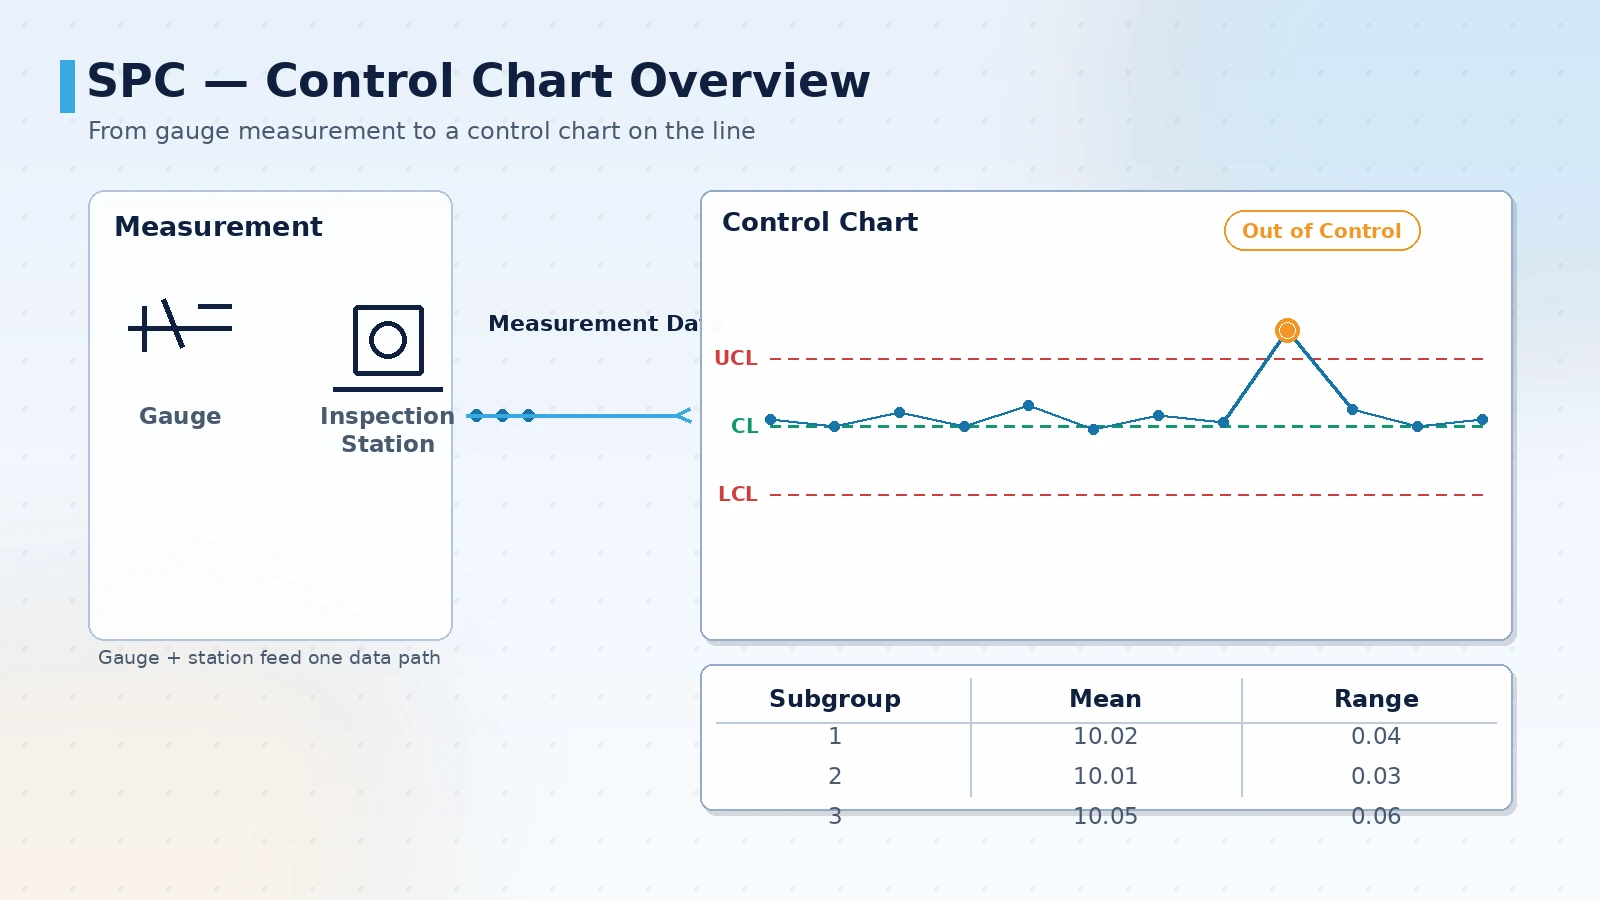
The three questions SPC answers
SPC's value is not a pretty line chart; it is turning process variation into a record that can be questioned point by point. Define the questions before you start, so every field has a reason to exist.
- Is the numeric distribution of this process stable today, or has it started to drift or trend
- Is the variation normal process variation, or has it already triggered an alert rule
- When an alert fires, who handled it, when, by which rule, and what was the outcome
- What is the process capability (Cp/Cpk), and does it meet the customer specification
- Can these conclusions be broken down by process, product, shift and machine
A common mistake is buying a reporting tool first and only then asking where the data comes from. A more reliable order is the reverse: define the measured characteristics and alert rules first, then the data capture, and only then the charts and dashboards.
Where measurement data comes from: capture layers
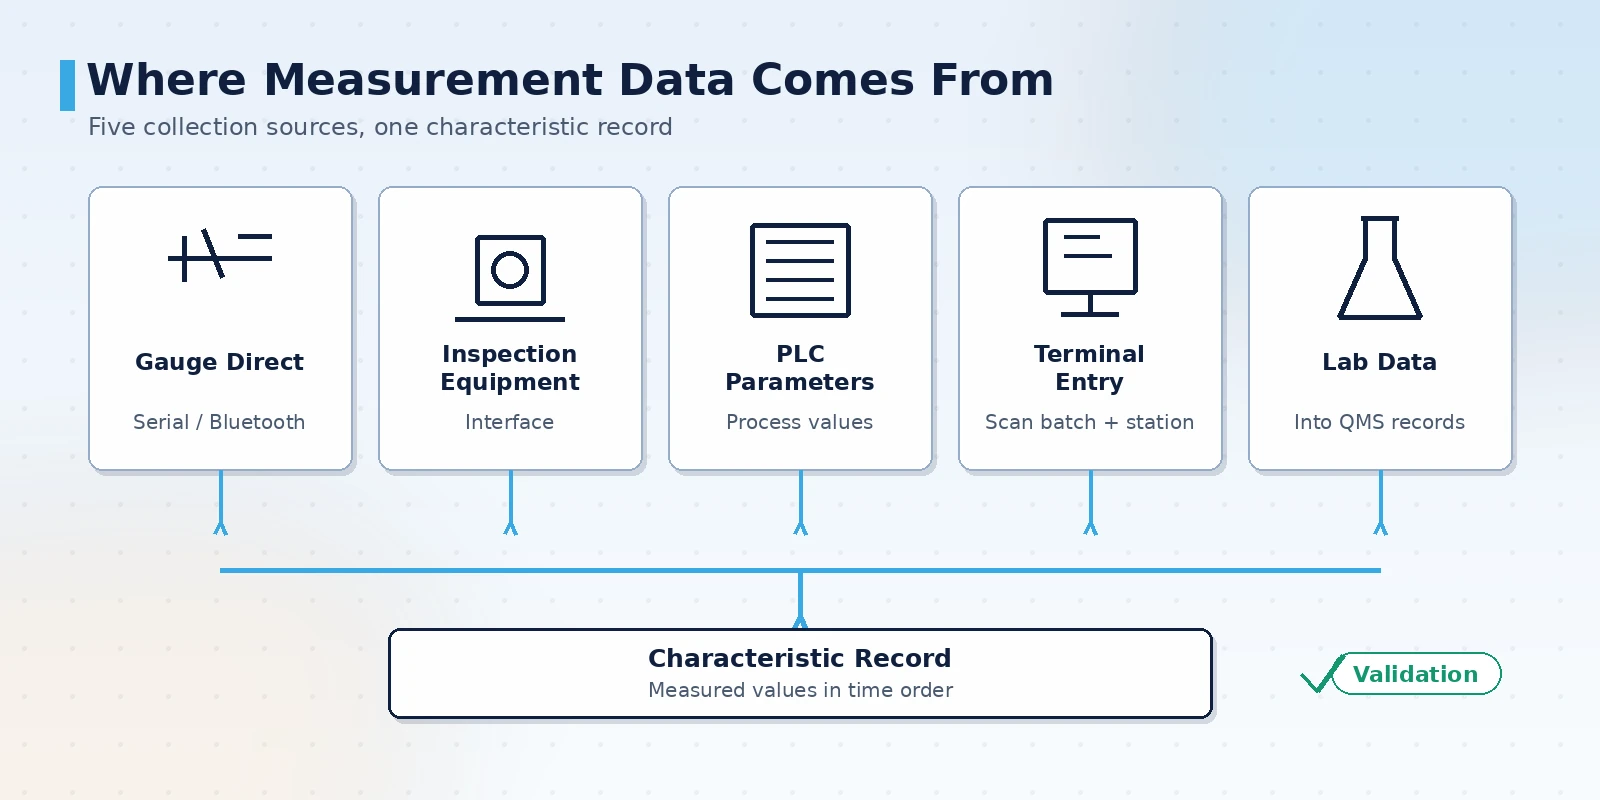
SPC is built on measured values of the same characteristic in time order. Site conditions vary widely, so whether data can be captured automatically and reliably decides whether the control chart means anything. The common approach combines several methods: automatic capture for high-volume stations and manual entry to cover what has no interface.
- Gauge connection: digital calipers, micrometers and CMMs write measured values directly into the system over serial or Bluetooth, cutting transcription errors
- Inspection equipment: optical measuring instruments, vision inspection stations and automated inspection lines return measured results and verdicts through interfaces
- PLC and process parameters: for characteristics reflected in equipment parameters, read process values from the controller as auxiliary monitoring
- Inspection station entry: incoming, first-article, patrol and outgoing inspections are entered at the terminal, with barcode scanners linking batches and stations
- Laboratory data: physical, chemical and mechanical laboratory results are merged into the same characteristic record through a data management system
- Data validation: entry checks upper and lower limits and gauge range, prompting a recheck on clearly abnormal values
Choosing control charts and alert rules
There is more than one type of control chart, and choosing the wrong one makes alerting fail entirely. Selection comes down to two things: whether the data is variable or attribute, and whether each sample is a single point or a subgroup.
- Single point beyond a limit: one point outside the control limit, usually pointing to a sudden cause
- Consecutive same side: several points on the same side of the center line, indicating the process mean has shifted
- Consecutive trend: several points monotonically rising or falling, pointing to systematic causes such as tool wear or thermal drift
- Near the limit: several points in the zone close to the control limit, a precursor to a shift
- Periodic or mixed pattern: points repeating in a cycle or a regular mixture, suggesting shift changes or material changes
| Data type | Common control chart | Typical use |
|---|---|---|
| Variable, single point | Individual-moving range chart | Long cycle time, one measured value per sample |
| Variable, subgroup | X-bar and R chart / X-bar and s chart | Multiple samples taken at once, process stability monitoring |
| Attribute, defectives | Fraction defective chart | Batch inspection, tracking the defect rate |
| Attribute, defects | Count of defects chart | Tracking the number of defects per unit |
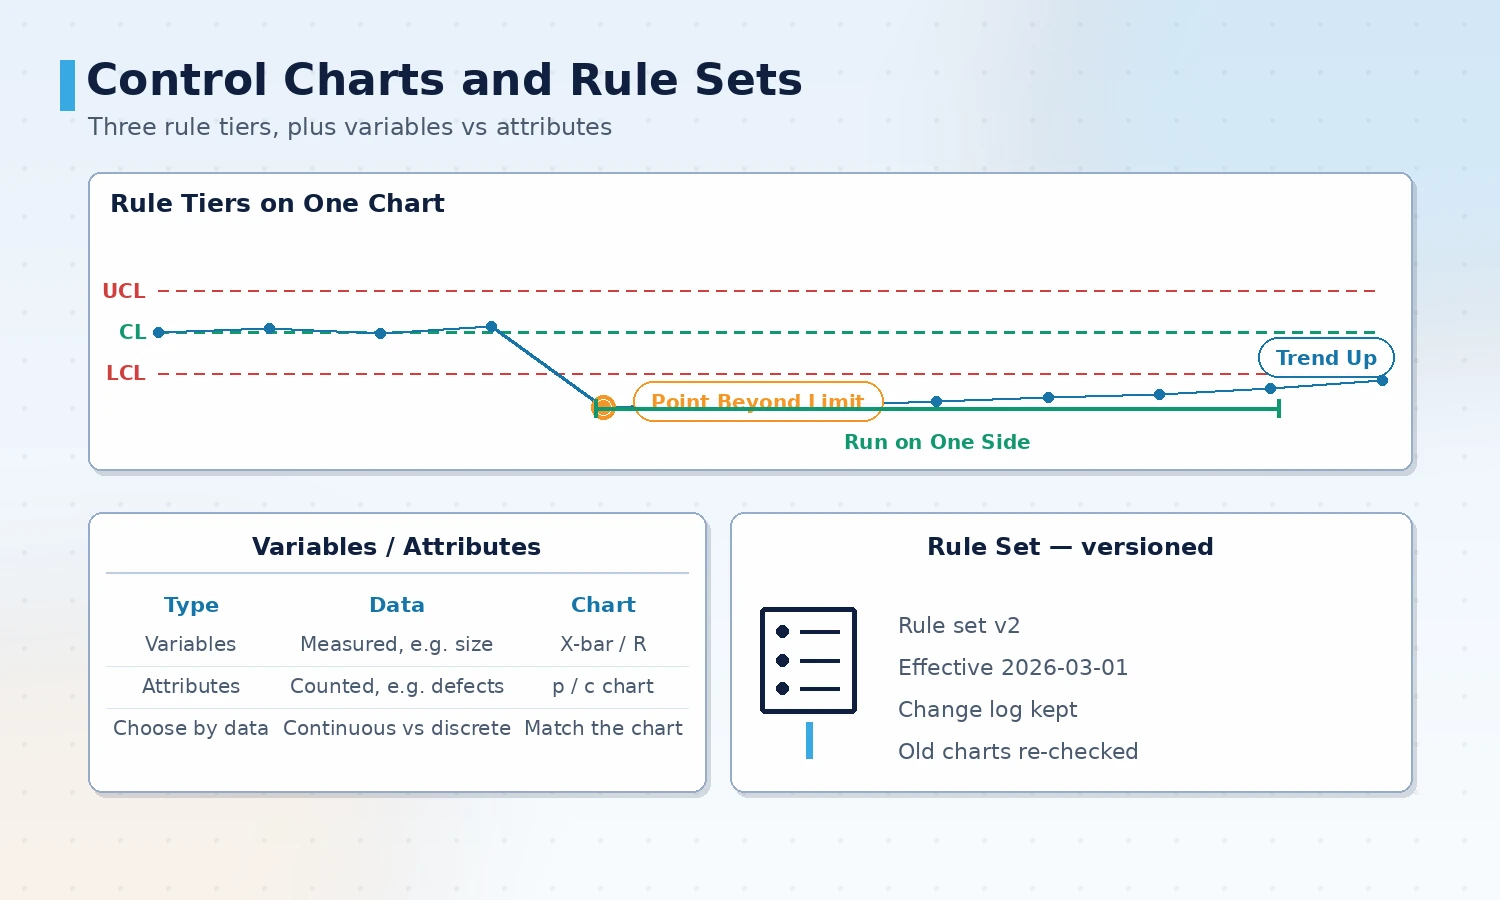
Alert rules must be versioned. When the rule set changes version, the comparability of historical alarms is affected, so changes must be logged and the switch-over time marked on reports.
Alert rules translate "something looks off" into executable conditions. A common rule set covers single points beyond a limit, several consecutive points on one side of the center line, several consecutive points rising or falling, and points in a periodic pattern. More rules is not better; an over-sensitive set drowns out the real anomalies.
Reading process capability: Cp and Cpk
Control charts answer "is it stable"; process capability answers "is it good enough". They belong together: a capability index computed on an unstable process is meaningless because the distribution keeps moving.
- Cp: the ratio of distribution width to specification width, reflecting potential and ignoring offset
- Cpk: accounts for distribution location as well, reflecting actual performance and the index customers look at most
- One-sided specification: use Cpu or Cpl when there is only an upper or only a lower limit, rather than forcing Cpk
- Prerequisite: confirm the process is in control before computing capability; unstable data needs cause analysis first
- Long-term and short-term: capability values from different time windows are not directly comparable, so reports must state the sampling interval
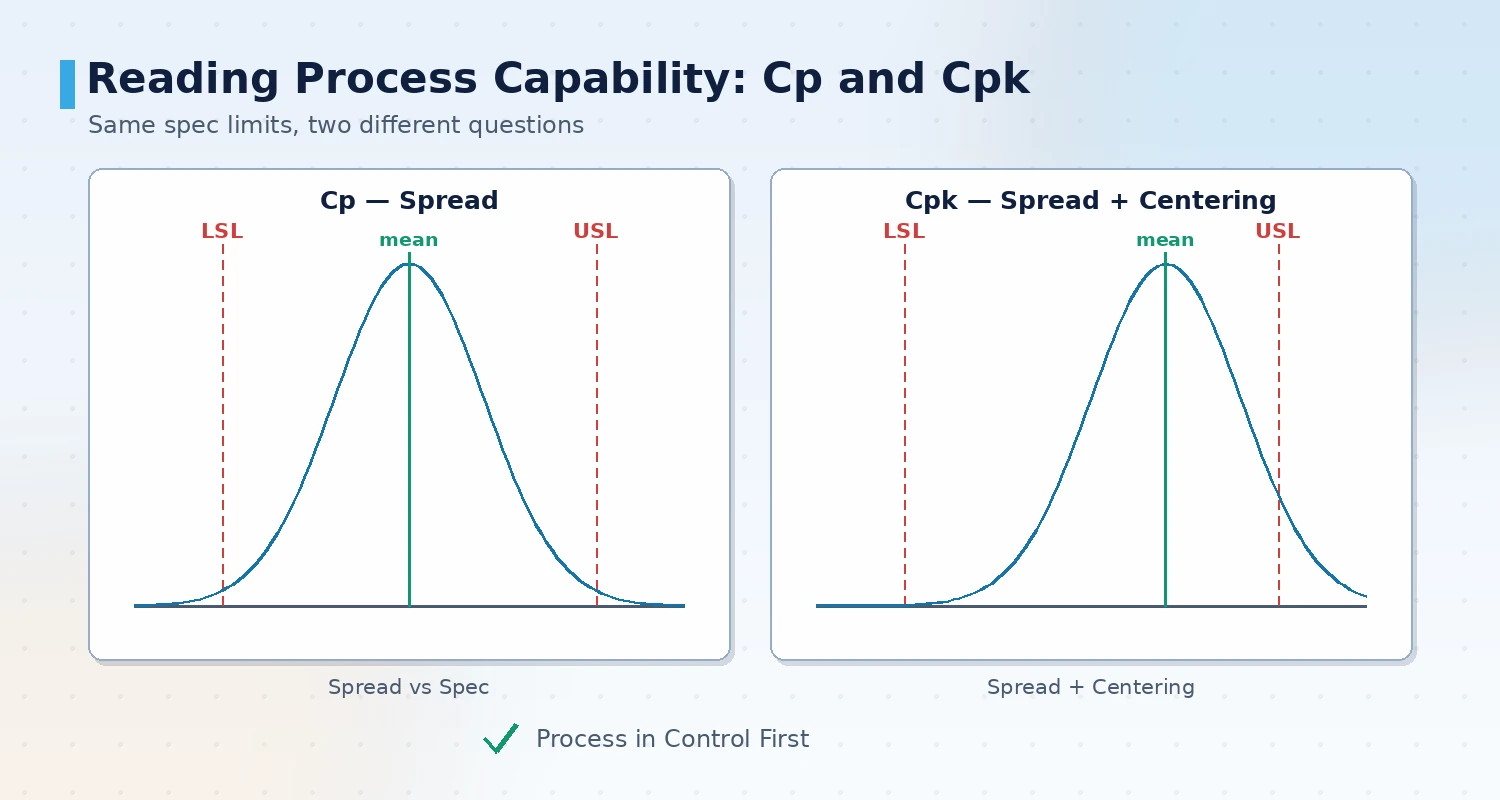
Define the specification source and measurement system before computing. Combining data measured by different gauges or different inspectors on the same characteristic inflates or dilutes the capability value with measurement error.
Alarm response and closure
A control chart alarm is only the start; the system only lands when a shift can respond by rule and leave a handling record. The response chain must be short and the responsibility clear, or alarms will quickly be ignored.
- Alarm tiering: separate hard rules such as a single point beyond a limit from soft trend rules, rather than treating them equally
- Notification path: alerts state the process, characteristic, rule and current value so a responder can judge on arrival
- Handling record: corrective action, cause, temporary measures and permanent countermeasures are written to the system as a traceable record
- Linked stop: for safety or critical characteristics, over-limit can be configured to stop the machine or hold the flow
- Effectiveness review: after a countermeasure lands, check whether the control chart and capability for the same characteristic actually improved
- Historical alarm search: retrieve past alarms by process, characteristic and time to find patterns in recurring problems
Boundaries with MES, inspection equipment and dashboards
SPC rarely stands alone; it divides work with MES, inspection equipment and dashboards, and clear boundaries avoid duplicated effort.
- With MES: MES manages work orders, batches and production execution; SPC takes batch and station context from MES instead of maintaining it twice
- With inspection equipment: gauges and inspection stations produce measured values; SPC analyzes the time series, and the two must not write each other's conclusions
- With dashboards: dashboards show current status and alarms; SPC keeps the historical series and statistical conclusions, so the display layer does not duplicate raw storage
- Single source of data: do not keep a copy of the same characteristic's measured values in several systems; settle on one authoritative source
Staged rollout
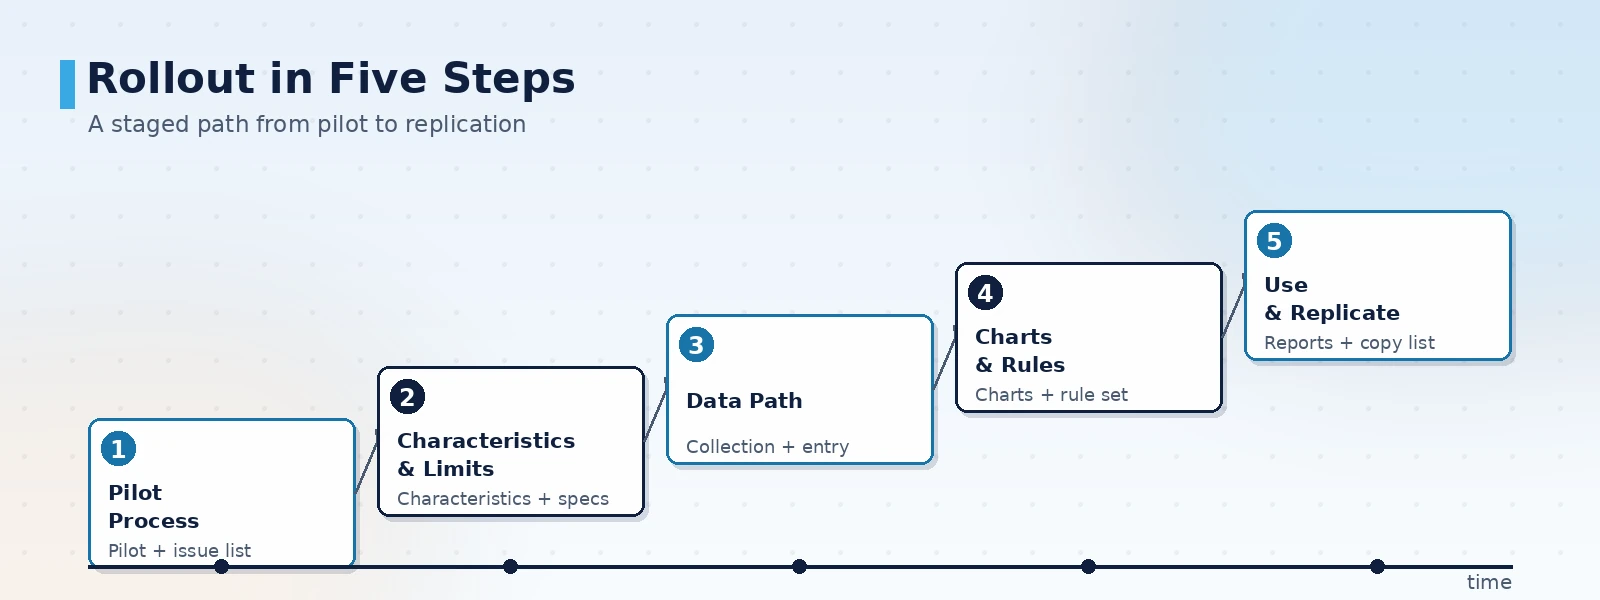
SPC should not cover the whole plant at once. Start with one critical process, get the characteristic list, alert rules and report templates working, then replicate to the next process for the lowest rework cost.
- Pick a pilot process: choose a critical process that greatly affects finished quality and has obtainable measurement data, and define the questions
- Set characteristics and specifications: with process and quality teams, list key characteristics, specification limits and sampling frequency
- Build the data path: decide how each characteristic is captured, and fill in manual entry where needed
- Configure charts and rules: select charts by data type, set the alert rule set and assign response owners
- Use the reports and replicate: publish control chart and capability reports, get the quality meeting to use them, then roll out by conclusion
Pilot selection and acceptance points
Acceptance is not about how the charts look; it is about whether the numbers and alerts match the shop floor. Check the following item by item before going live to avoid a system nobody uses.
- Characteristics and specifications traceable: each characteristic has a documented specification, sampling frequency and data source
- Capture accuracy: automatically captured values have been compared against manual rechecks, with deviation within an acceptable range
- Rules explainable: every alert rule has a clear meaning and response action that a shift can understand
- Capability correct: confirm in-control before computing capability, and use the matching index for one-sided specifications
- Records searchable: alarms and handling records can be retrieved by process, characteristic and time to support improvement
ORPAON has developed industrial software and automation systems since 2009, with project experience in shop-floor data acquisition, quality control and production visualization. Its delivered scope covers measurement data acquisition, quality data analysis and statistical process control systems, and it provides solution design and system development for machining, injection molding, stamping, assembly and electronics assembly, with engineers available for direct contact.
Conclusion
The hard part of an SPC system is not the control chart itself but the reliability of measurement data and the definitions behind the alert rules. Start with one critical process: define the characteristic list and specifications, build the capture path, configure the charts and rules, and use control chart and capability reports to drive the quality meeting, then replicate to the next process once proven. When selecting, check five points: traceable characteristics, capture accuracy, explainable rules, correct capability analysis and searchable records, so alerts are trusted after go-live. ORPAON provides solution design and development of measurement data acquisition, quality data analysis and statistical process control systems for machining, injection molding, stamping and electronics assembly, supports integration with MES and inspection equipment, and offers direct engineer contact.
Talk to us about an SPC process control plan
Tell us your critical processes, measurement methods and current quality control practice, and we can propose a capture method, control chart and alert rule design, and capability analysis recommendations based on your site conditions, with engineers available for direct contact.
Book a solution discussion
Tell us your critical processes, measurement methods and current quality control practice, and we can propose a capture method, control chart and alert rule design, and capability analysis recommendations based on your site conditions, with engineers available for direct contact.
Contact Us