Production Status Display Board System on the Shop Floor
A production status display board system consolidates line takt, shift output, equipment running status, downtime reasons and quality rate onto a shop floor display and line-side screens. Its value is not the screen size but the fact that people on the floor can look up and know what to do next: which station is behind, which machine has stopped, which batch is waiting for inspection.
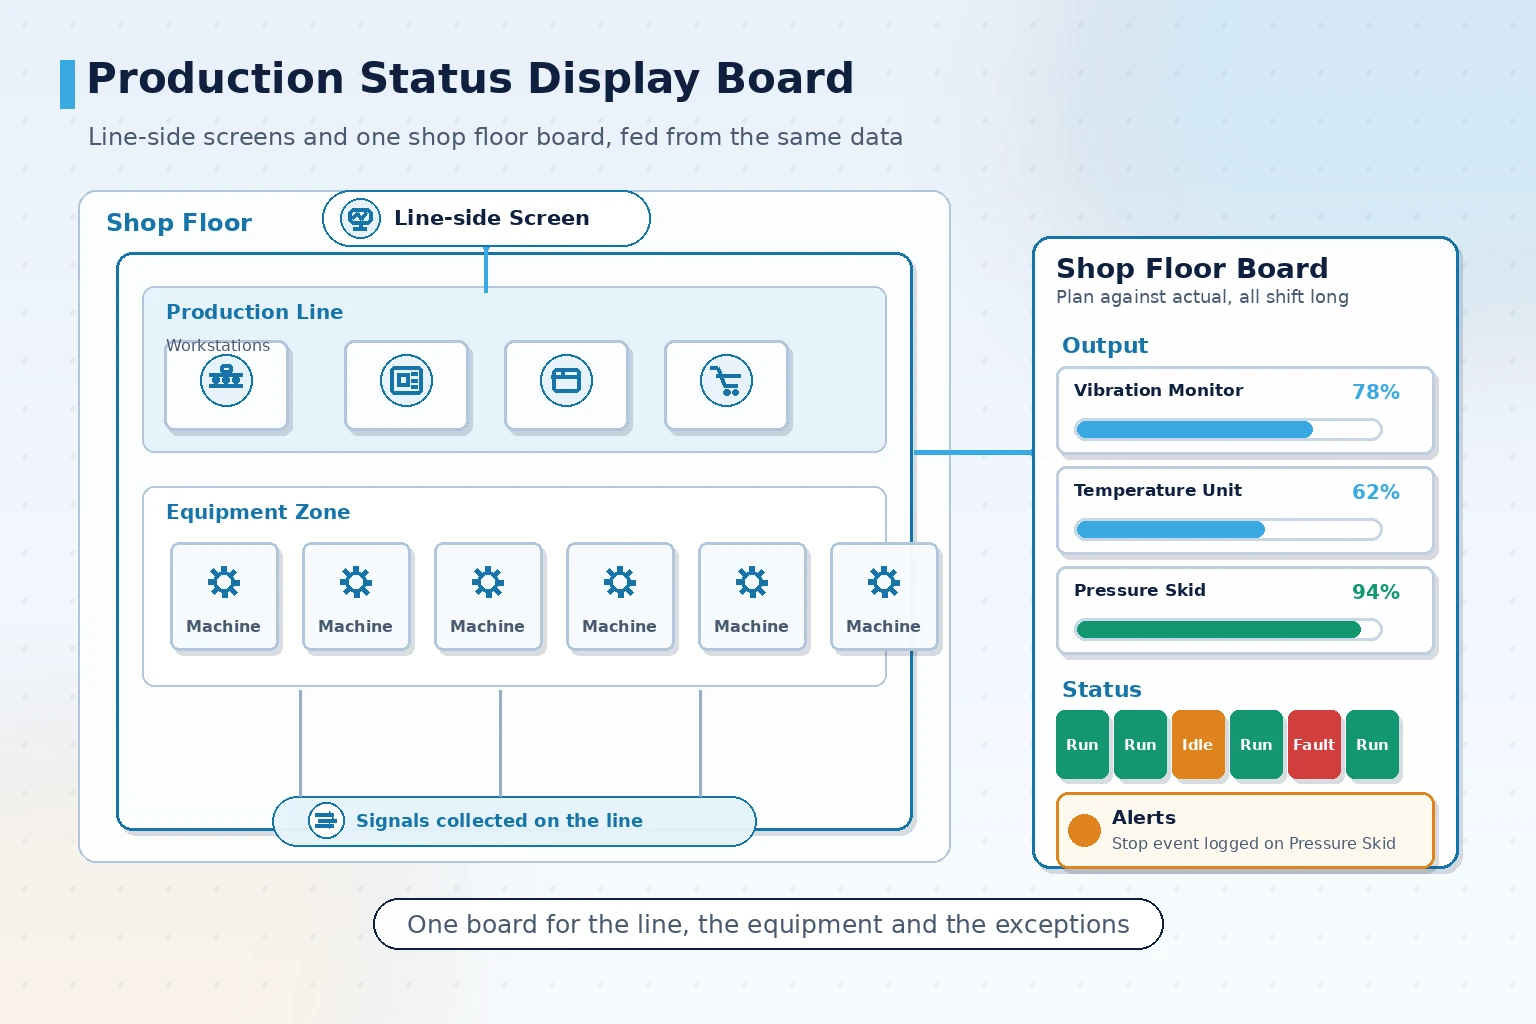
How a board system differs from copying data onto a big screen
A very common shortcut on the shop floor is copying a spreadsheet onto a display and updating the numbers by hand. A screen like that looks convincing in week one and becomes decoration by week three, because nobody keeps updating it.
A real production status display board system differs in three places: data arrives automatically, judgement happens inside the system, and refreshing needs no human intervention.
- Data arrives automatically: values are polled from PLCs, meters, barcode scanners or MES interfaces on a fixed cycle, with no manual entry
- Judgement sits in the system: attainment, deviation and overdue states are calculated by rules rather than judged by eye
- Refresh needs no one: shift rollover, field rotation and alert pop-ups are driven by rules
A practical test: if nobody touched the screen when the shift ended and the figures are still correct the next morning, the board is actually working.
What a board should display: deriving fields from management goals
More fields is not better. If people are expected to read the board from three metres away within five seconds, the number of fields has to be kept small.
The usual approach is to ask which management action the screen serves, then decide what it shows:
| Management goal | Suggested fields | Refresh cadence | Presentation |
|---|---|---|---|
| Shift output attainment | Plan, actual, attainment rate, time remaining | Minute level | Figures plus progress bar |
| Equipment status | Running, idle, fault, downtime duration | Second level | Status colour blocks |
| Downtime tracking | Downtime reason, accumulated duration, owning team | Event triggered | Reason ranking |
| Quality status | Pass rate, batches awaiting inspection, abnormal batches | Per inspection batch | Figures plus prompt colour |
| Alerts | New alerts, items past response time | Real time | Scrolling strip or pop-up |
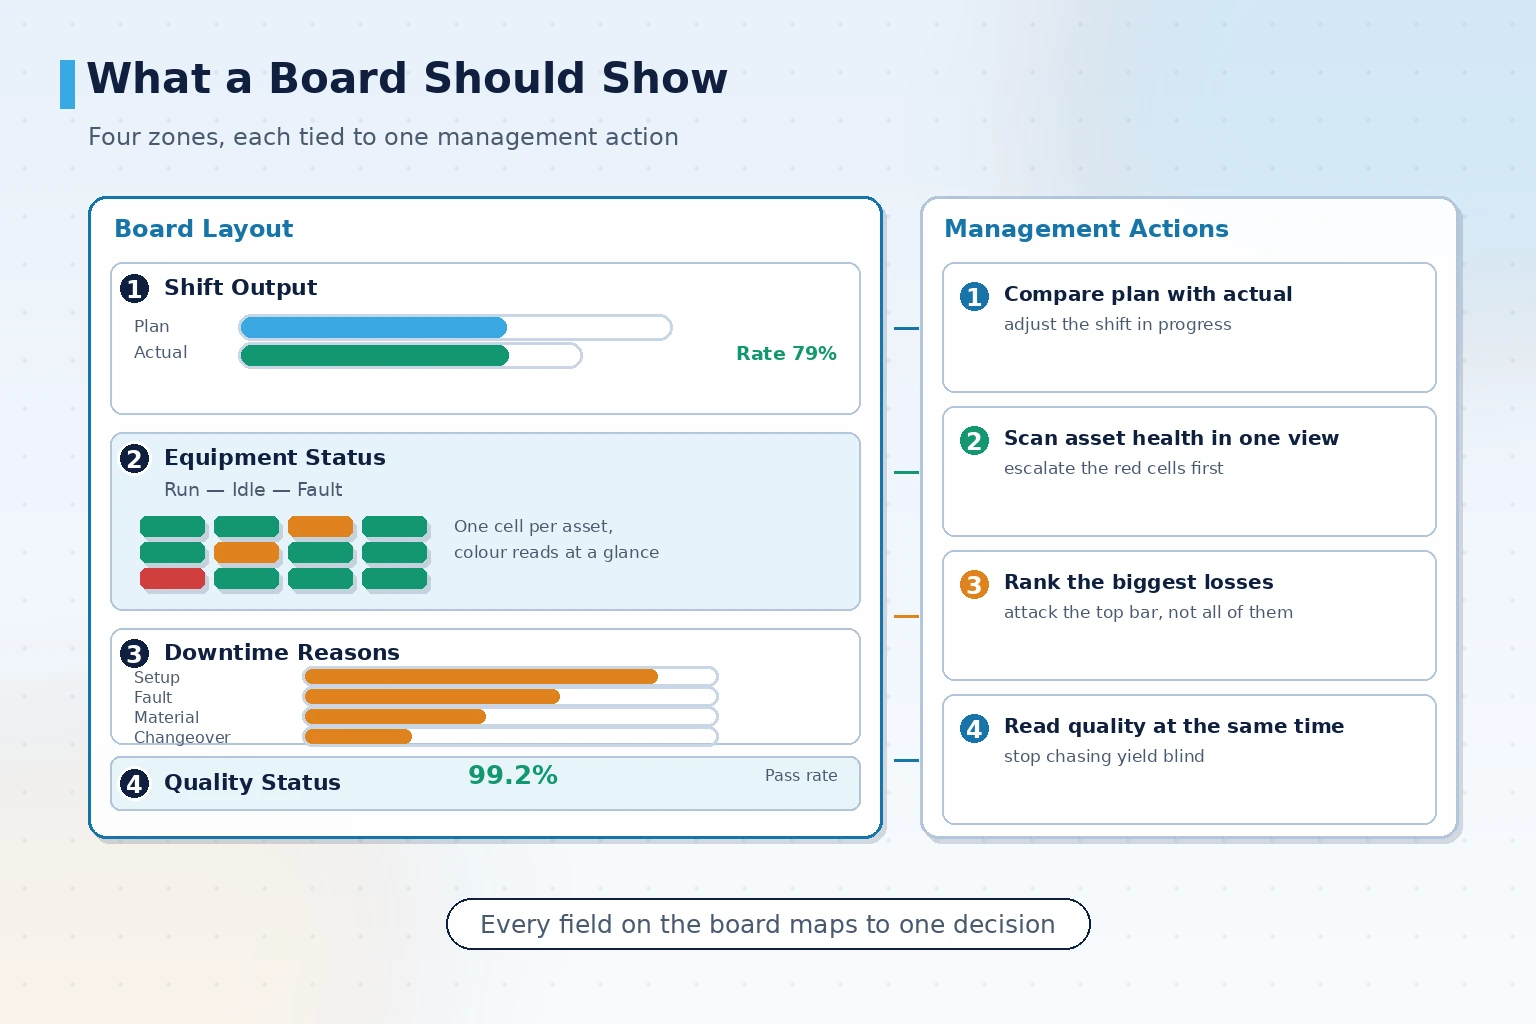
One practical rule: avoid making a single screen carry both team performance ranking and live status monitoring. The first is read monthly and the second is read by the second, and mixing them means neither audience finds the point.
Where the data comes from: choosing between three acquisition paths
The ceiling of a board is set by how its data is acquired. For the same output figure, different sources differ greatly in cost and reliability.
- Directly from a PLC or equipment controller: strong real-time behaviour and the most faithful fields, provided the equipment has a usable communication port and a parseable protocol
- From add-on acquisition hardware such as power meters or counting sensors: suited to older machines with no communication port, lower cost, but only coarse-grained signals
- From an MES or ERP interface: already-organised process and work order data, with real-time behaviour limited by the refresh cycle of the upper system
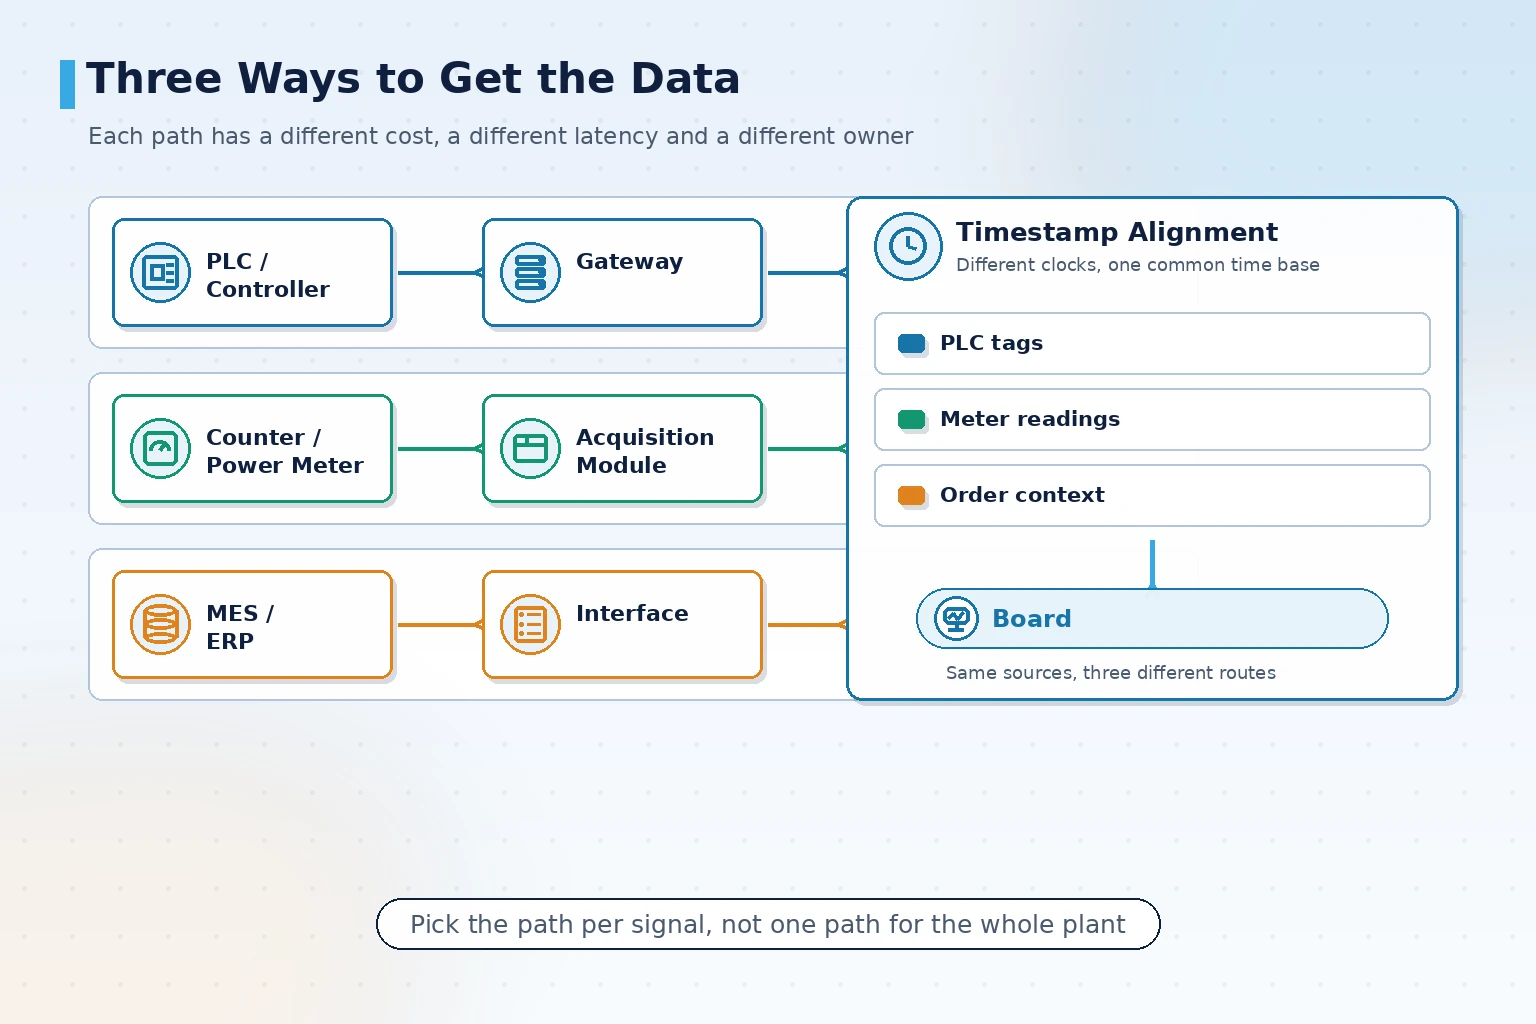
In real projects the three are usually mixed: equipment status from the PLC, output from a counter, work order plan from the MES. The key to mixed acquisition is aligning timestamps, otherwise the board shows output that has arrived against a plan that has not yet updated.
For older machines without a communication port, the usual approach is to add acquisition hardware rather than modify the machine itself. Modifying the machine usually means stopping production, dismantling and re-acceptance, with costs and risks out of proportion to the benefit.
Refresh rates, shift rollover and alert scrolling rules
Boards stop being read over time, and the reason is rarely a broken screen: the display rules no longer follow the team's rhythm.
Shift rollover is the moment where boards most often go wrong. If the previous shift's output and downtime are not reset at the handover time, the incoming team reads contaminated figures. The system needs reset and accumulation rules configured against the plant's actual shift timetable, with a historical snapshot of the previous shift retained for traceability.
Alert scrolling should be ordered by priority rather than by time of occurrence. A new high-severity alert should pop up immediately and stay, while low-level notices can join a rotation queue. Scrolling everything together means the important information gets washed out.
Refresh rates should also be set per field: seconds for equipment status, minutes for output, shift level for attainment. Refreshing every field at the highest rate wastes acquisition bandwidth and leaves the screen constantly flickering.
Screens and site conditions: size, brightness and placement
The same software can perform very differently on different sites. Site conditions are the most underestimated part of a board project.
- Viewing distance drives size: station-level small screens for around three metres, aisle displays for ten metres or more, with text height derived from viewing distance
- Ambient light drives brightness: workshops with direct sunlight need high-brightness panels, otherwise reflections wash out the screen at midday, while dark areas should avoid excessive glare
- Placement drives content: line-side screens for takt and alerts, central shop floor boards for team and equipment overview, office views for trends and reports
- Dusty or oily environments need the panel's ingress protection rating and cleaning method confirmed
After installation, maintainability also matters: who cleans the panel, who replaces it when it fails, and whether spares are kept on site. Left unsettled at acceptance, these questions tend to become an unclaimed corner after handover.
Delivery boundaries and acceptance: what to settle before starting
Disputes in board projects cluster around two questions: who supplies this field, and is this number correct. Writing the boundaries down before acceptance saves a great deal of later explanation.
An acceptance checklist should include:
- Field list reviewed item by item: source, unit, calculation basis and update cycle confirmed in writing for each field
- Data path tested: disconnect the acquisition path once and confirm backfill and recovery match reality
- Shift rules verified: reset, accumulation and snapshot retention tested against the actual shift timetable
- Alert rules tested: each rule triggered once, with severity, pop-up behaviour and hold duration confirmed
- Permissions and traceability: account levels, operation logs and field modification records traceable
- On-site readability confirmed: fonts and colour scheme legible at the actual viewing distance and ambient light
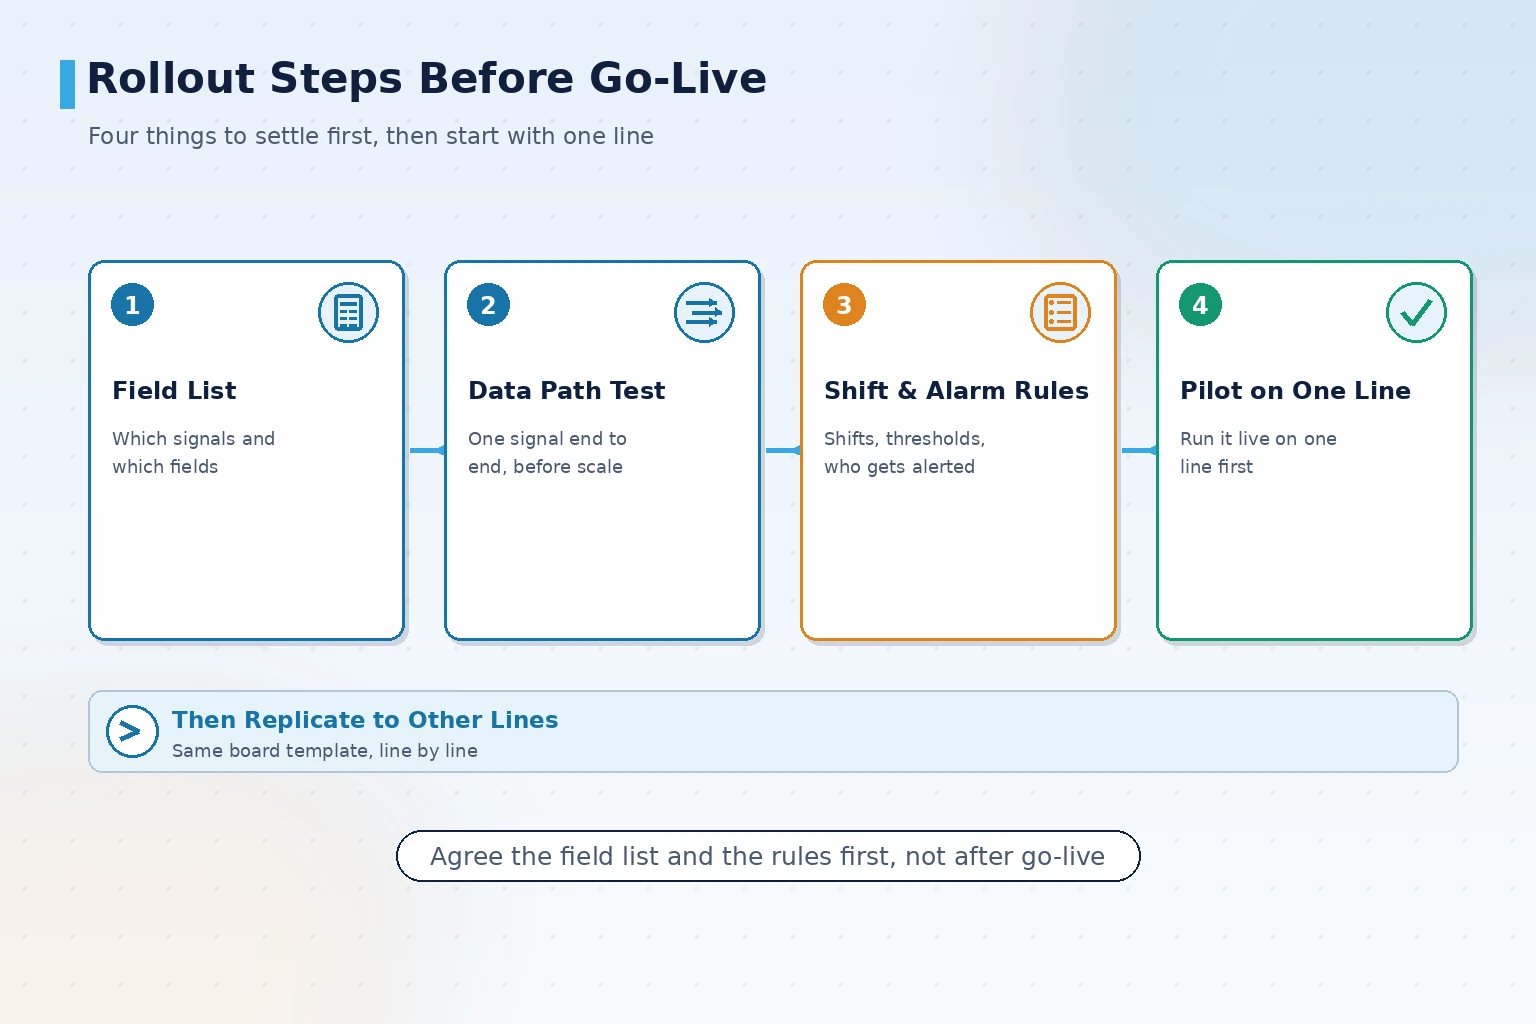
During the pilot, keep a period of parallel running: board readings and the existing manual records side by side, retiring the old method only once the two agree.
Delivery status normally has three tiers: already delivered (in operation on site), deliverable (solution and references ready for immediate start) and customisable pilot (validated against site conditions). For multi-line plants, run a pilot on one line or one screen first, stabilise the data path and refresh rules, then replicate to the remaining lines, because the cost of replication sits in the acquisition points rather than the software.
Where a board lands: shop floor information that no longer depends on shouting
A production status display board system is not about whether to buy a large screen. It is about how shop floor information travels today, how quickly it is seen, and whether it can be checked afterwards. The acquisition path sets the ceiling, shift and alert rules decide whether anyone reads it, and site conditions decide whether it can be read at all. Settle those three and the screen will not become decoration within six months.
Where a board lands: shop floor information that no longer depends on shouting
A production status display board system is not about whether to buy a large screen. It is about how shop floor information travels today, how quickly it is seen, and whether it can be checked afterwards. The acquisition path sets the ceiling, shift and alert rules decide whether anyone reads it, and site conditions decide whether it can be read at all. Settle those three and the screen will not become decoration within six months.
Book a product demonstration
If you are assessing which fields a shop floor board should display and whether your existing equipment can supply the data, book a product demonstration and we will propose fields and an acquisition path based on your lines and management goals.
Contact Us