OEE Equipment Efficiency Monitoring System Guide
An OEE equipment efficiency monitoring system answers three questions: how long a machine was supposed to run, how long it actually ran, and whether everything produced in that time was good. It records machine state, downtime reasons and production and quality data under one agreed standard, calculates availability, performance and quality, and breaks those numbers down by machine, shift and loss type. This article covers the paths for capturing machine state, the rules for attributing downtime and losses, data quality and time alignment, the three-factor calculation, common analysis views, a phased rollout, and the points to check when choosing a pilot line and accepting the system.
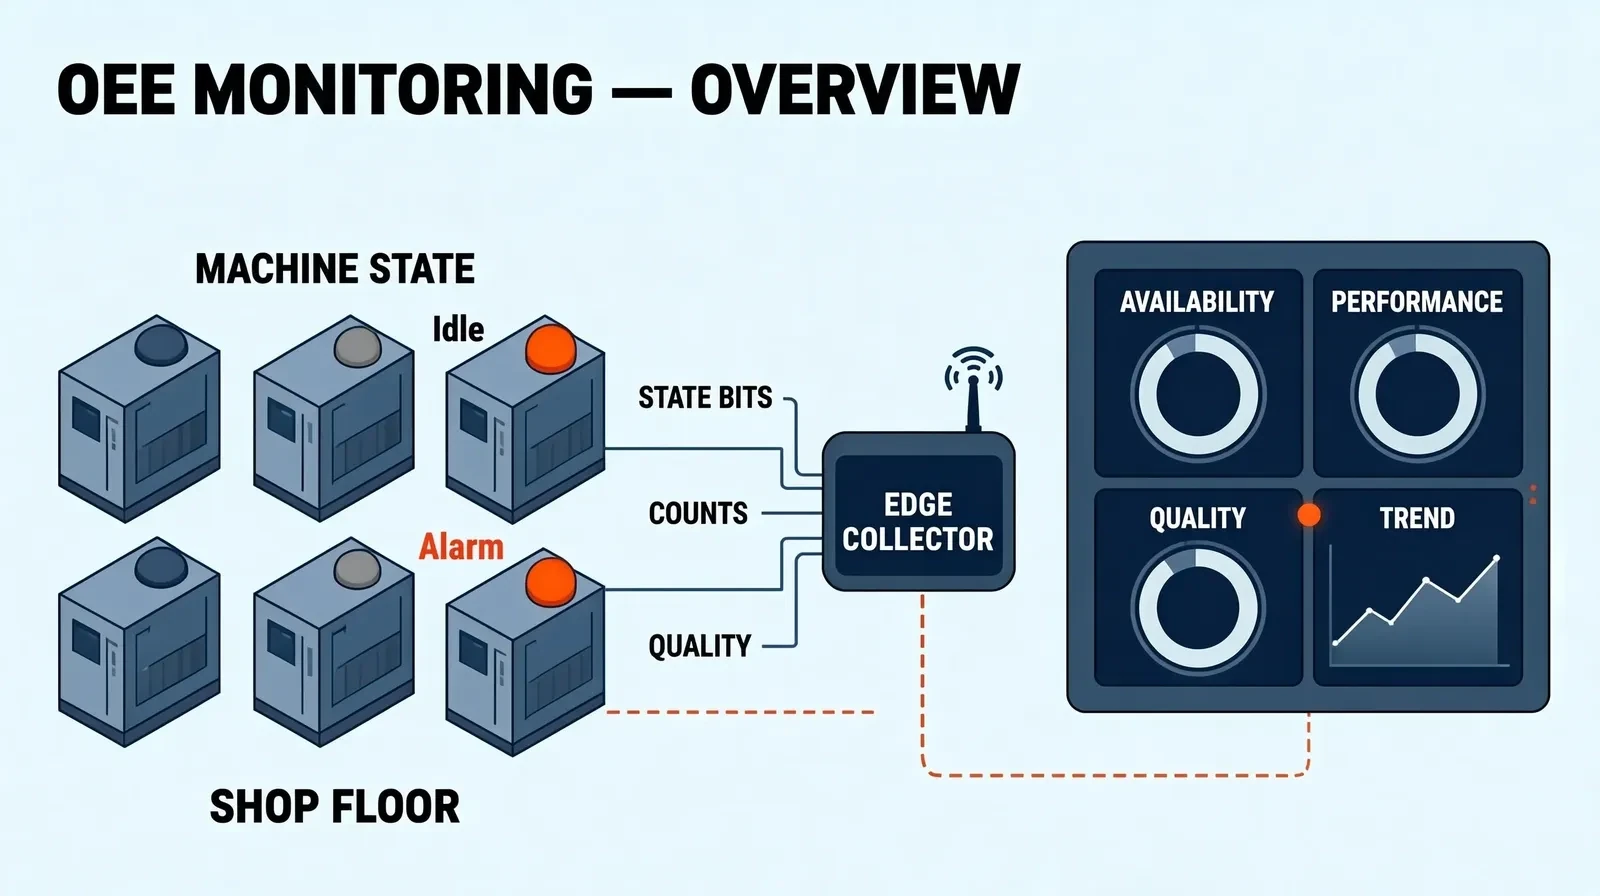
The three questions OEE has to answer
The value of OEE is not a final percentage; it is turning "where exactly is the equipment losing time" into a record you can question line by line. Decide which questions the system must answer before you build it, so that every field has a reason to exist.
- How much of the planned production time is actually used for production
- Where the machine really stopped: breakdown, changeover, material shortage or waiting
- Whether speed dropped while the machine was running, and whether minor stops and idling are recorded
- How many of the parts produced need rework or scrap, and on which machine and shift
- Whether these questions can be broken down by machine, shift and product at the same time
A common mistake is to buy dashboard software first and ask where the data will come from later. A safer order is the reverse: agree the definitions first, then the capture, and only then the dashboard.
Where machine state comes from: capture layers
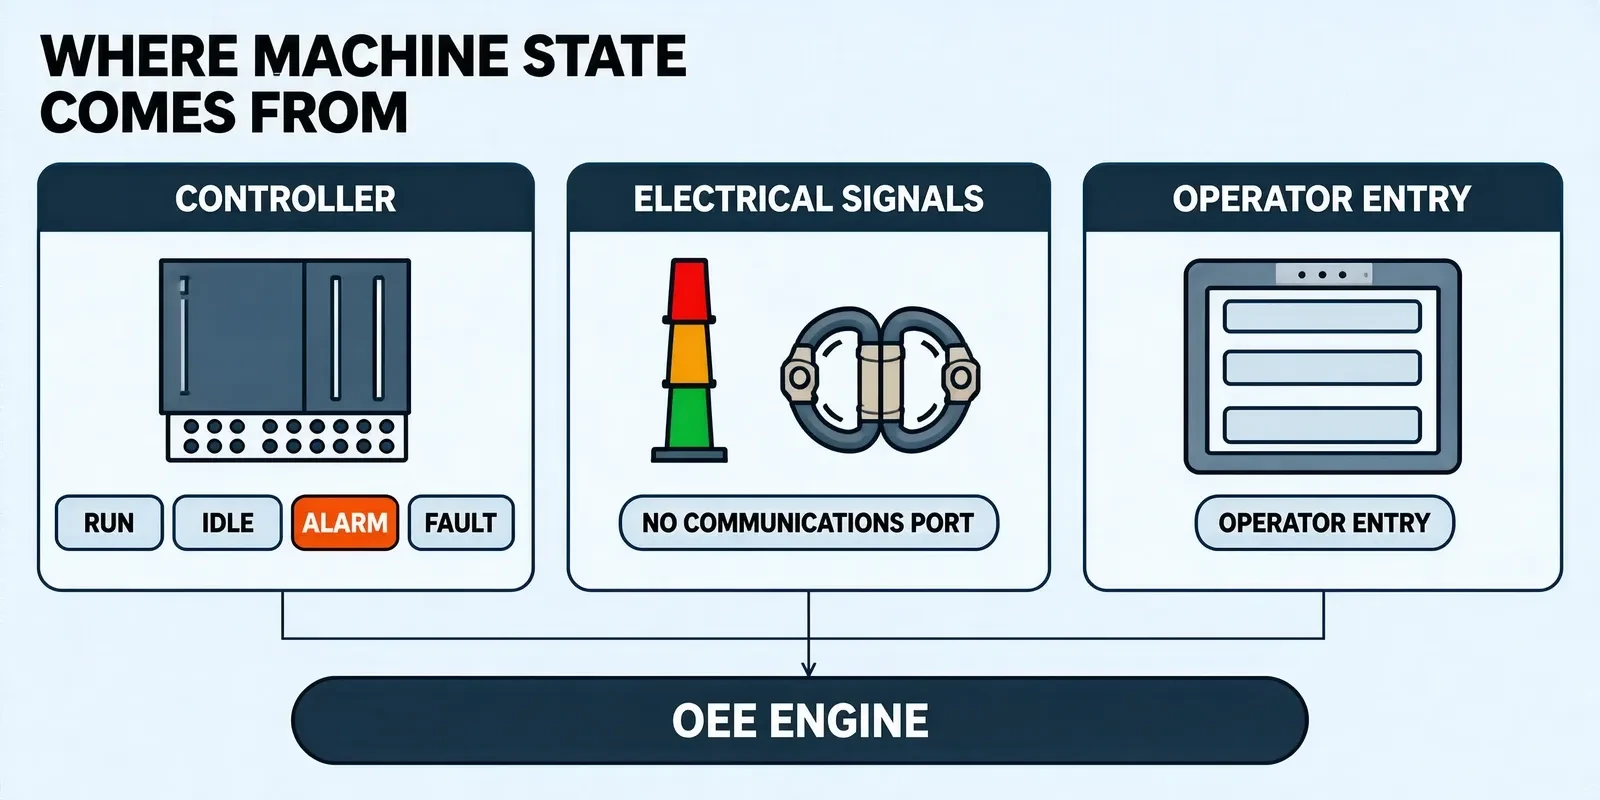
OEE rests on a record of how machine state changes over time. Shop floors differ widely, and which signals a machine can give you determines how accurate that record can be. In practice several capture methods are combined: automatic capture covers the main machines, and manual entry covers the periods where no signal is available.
- Controller signals: read run, idle, alarm and fault state bits from the PLC or machine controller; accuracy depends on which points the machine exposes
- Electrical and signal lights: use current transformers, three-colour lights or relay contacts to tell whether a machine is running, suitable for older machines without a communications port
- Counts and cycle signals: derive actual processed quantity and speed from a production counter or cycle signal, used for performance
- Process parameters: spindle speed, pressure and temperature help confirm the machine is in effective processing state
- Quality data: interface with inspection stations, vision systems or rework records to obtain good and defective quantities
- Manual entry: for changeover, waiting and trial runs with no automatic signal, the team selects a reason code on a terminal as a fallback
Downtime and loss attribution: agree the definitions first
A downtime breakdown looks like a way of sorting time, but it actually decides whether the OEE figures can drive improvement. The same twenty minutes attributed to a breakdown or to a changeover calls for completely different action. Before starting, agree the classification with process, equipment and production teams, and write it up as a reason code table that can be maintained.
| Loss category | Common timing method | Attribution point |
|---|---|---|
| Breakdowns | Alarm start and end | Separate sudden failures from slow small stops, which are often missed |
| Setup and adjustments | Work order switch start and end | Align with the work order system to avoid double counting against waiting |
| Minor stops and idling | Threshold events or manual counts | Define in advance how long counts as one stop and when it starts to count |
| Speed loss | Actual cycle versus standard cycle | The standard cycle must state its source and version |
| Defects and rework | Inspection results and rework records | The good and scrap definitions must match the quality department's |
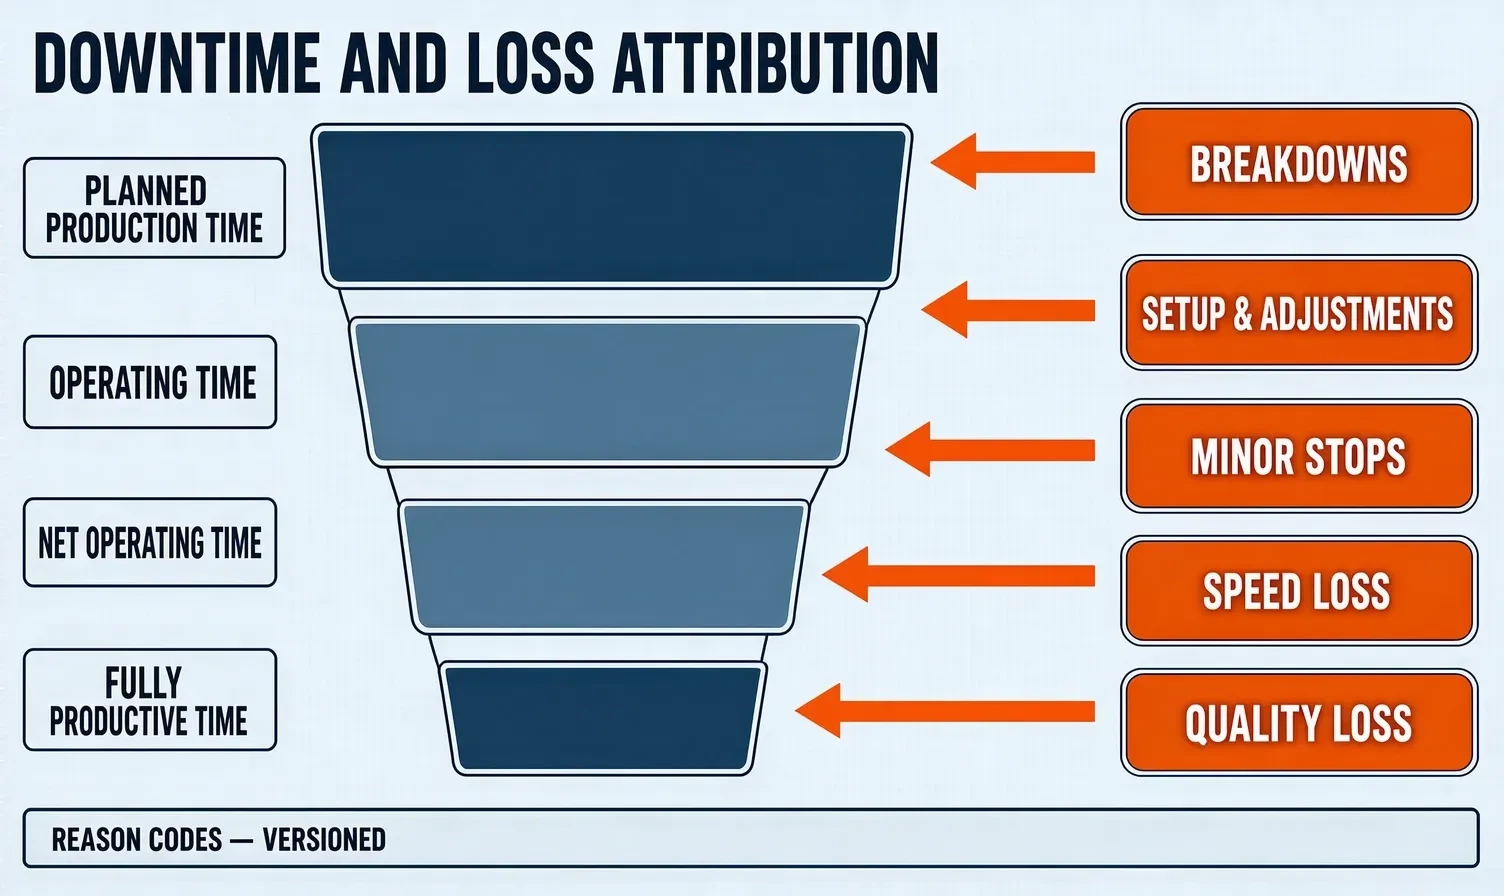
Once agreed, the definitions must be versioned. Changing the reason code table affects the comparability of historical data, so changes should be recorded and the switch-over time shown on reports.
Data quality and time alignment
The part of an OEE report that gets questioned most is not the formula but the data itself. Clocks that disagree across machines, dropped points during network outages and jitter on state bits all bias the downtime duration. These are engineering problems and can be handled item by item in the design.
- Clock synchronisation: capture devices and the server use one time source, so the same event does not land on different seconds in different systems
- Offline buffering: during a network outage the edge device writes to disk first and back-fills after recovery, so no gaps appear in the data
- State de-bouncing: filter state bits by a minimum duration so a momentary flicker is not recorded as several stops
- Cross checks: production counts, cycle signals and running time validate each other, and clearly contradictory data should be flagged
- Change traceability: manual entry and corrections record the operator, time and reason, so the data stays auditable
How the three OEE factors are calculated
The standard method splits OEE into three factors that are multiplied, so that a problem in any one factor can be located on its own instead of being described vaguely as low efficiency.
- Availability: actual running time divided by planned production time, reflecting downtime loss
- Performance: actual output divided by the theoretical output for the running time, reflecting speed loss
- Quality: good quantity divided by total output, reflecting quality loss
- The product of the three: gives the OEE value, and any factor that is low deserves its own investigation
Decide first how planned production time is defined. Whether it includes planned maintenance, shift handover meetings and planned line stops changes the denominator completely, so comparisons across workshops must use the same definition.
From data to improvement: common analysis views
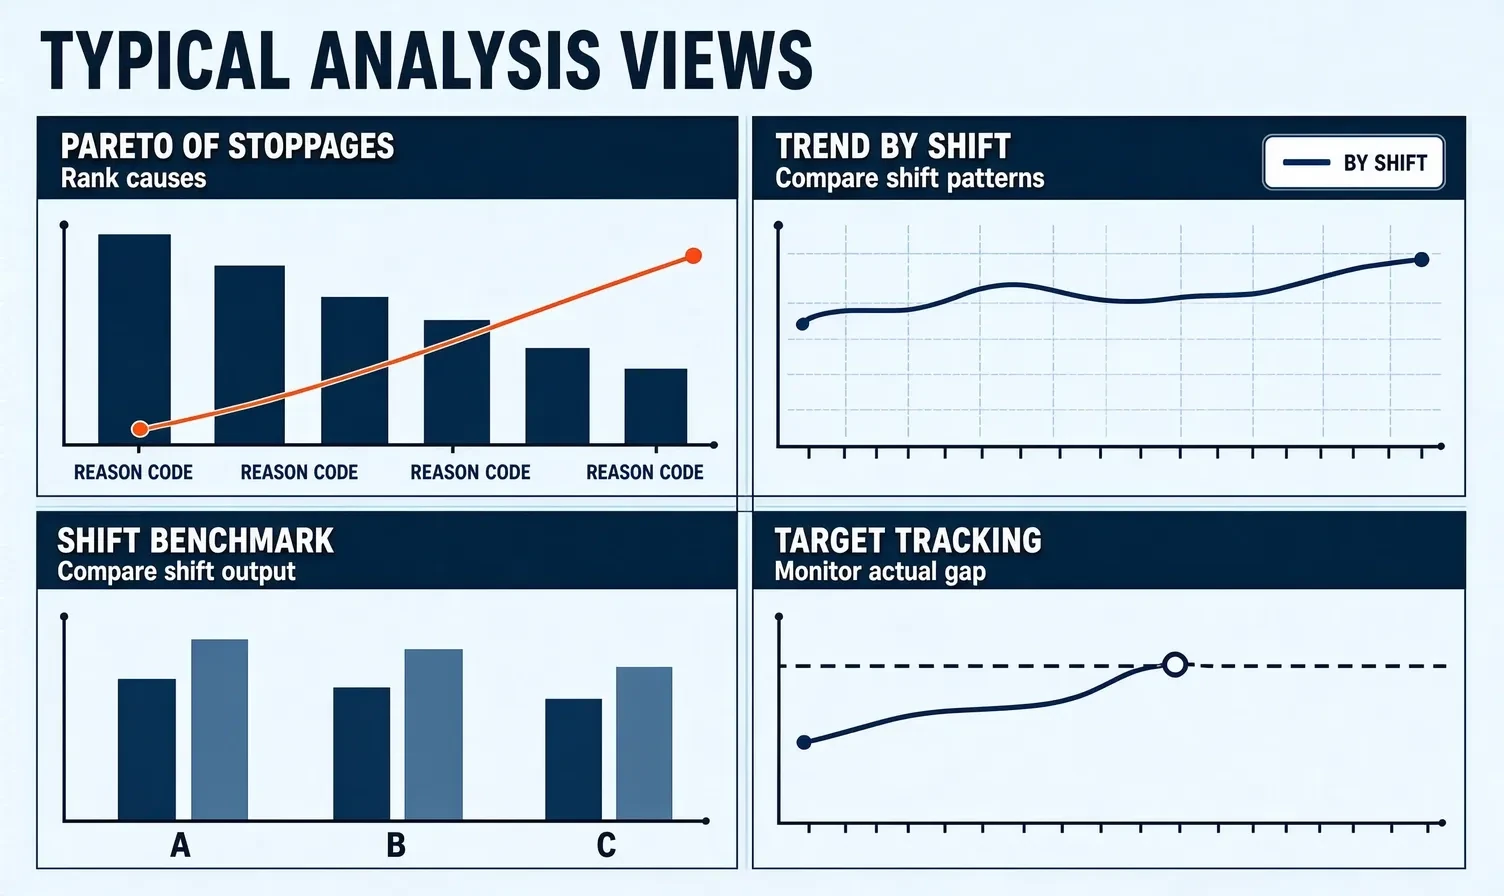
Capturing the data is only the start. The system has really landed when the shop floor meeting uses it to discuss problems. There are only a few common views, but each one should point directly to an improvement action.
- Pareto of stoppages: rank downtime over a period by reason code and find the leading contributors
- Trend curves: watch OEE and each factor by day or by week to judge whether improvement is holding
- Shift and team benchmarking: put the same machine's data for different shifts side by side to expose operating and handover issues
- Target tracking: show target and actual on the same screen so the gap is obvious
- Drill-down to machine and line: move from a workshop-level figure down to a specific machine to locate the problem asset
- Before and after comparison: record when a measure was introduced and validate the effect with the data on both sides
A phased rollout path
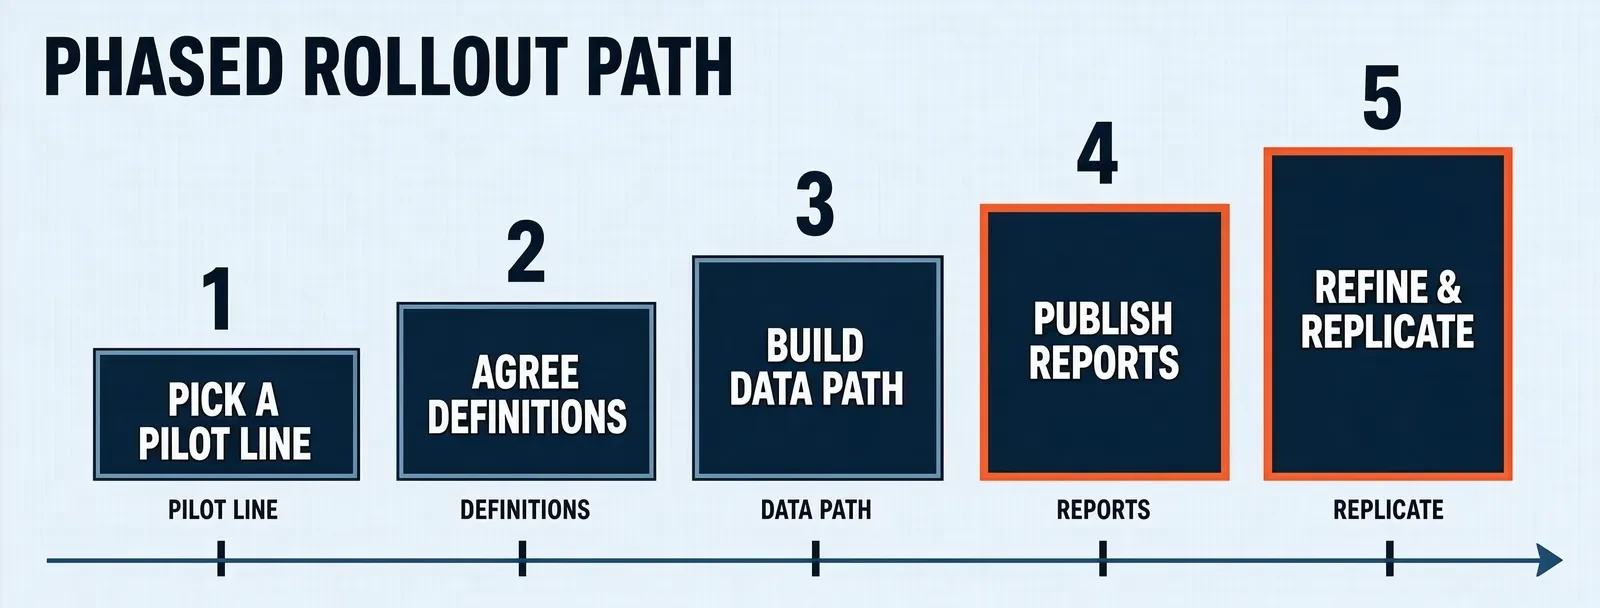
OEE is not best rolled out across a whole factory at once. Start with one line, get the definitions, capture methods and report templates working, then copy to the next line; that keeps rework cost at its lowest.
- Pick a pilot line: choose a line with clearly fluctuating machine state and a pressing need to improve, and state which questions it must answer
- Agree definitions and reason codes: with process, equipment and production, fix the time classification, the reason code table and the source of the standard cycle
- Build the data path: decide how each machine's state and output will be captured and add the manual entry points
- Publish reports and use them: start with the stoppage Pareto and the shift benchmark so the shop floor meeting really uses them
- Refine and replicate: adjust definitions and templates from the trial feedback, then extend to the next line or workshop
Points to check when choosing a site and accepting the system
Acceptance is not about whether the dashboard looks good, but whether the numbers match the shop floor. Going through the points below before starting avoids a system that nobody uses after go-live.
- Traceable definitions: time classification, reason codes and standard cycle have written definitions with a stated source and version
- Capture accuracy: automatically captured states have been compared with real stoppages on site, and the deviation is within an acceptable range
- Usable manual entry: the entry point at the station is convenient enough that the team will fill it in, otherwise the data means little
- Time alignment and buffering: network outages, restarts and clock drift each have a defined handling method
- Report usability: at least one report can be used directly in the shop floor meeting, rather than only showing a percentage
Boundaries with MES and energy management
OEE rarely stands alone. It shares work with MES and energy management, and agreeing the boundaries avoids building the same thing twice.
- With MES: MES manages work orders, materials and production execution; OEE takes work order and product context from MES instead of maintaining it again
- With maintenance: downtime reasons link to maintenance work orders, so breakdown stops can generate a repair request directly
- With energy management: OEE looks at equipment time utilisation while energy management looks at energy per unit produced; both share the same output and running time data
- One source of truth: do not calculate running time for the same machine separately in several systems; choose one place as the authoritative source
Since 2009, Shanghai Chengxuan Intelligent has developed industrial software and automation systems, with project practice in shop floor data acquisition, production visualization and efficiency management. Its delivery scope covers equipment data acquisition, production dashboards and efficiency statistics systems, with solution design and system development for machining, injection moulding, stamping, final assembly and packaging, and engineers available for direct contact.
Conclusion
The hard part of an OEE system is not the formula but the definitions and data quality. A practical order is to start with one line whose machine state fluctuates clearly, agree the time classification and reason codes first, then build the data path and fill in manual entry, and finally put the stoppage Pareto and shift benchmark in front of the shop floor meeting. Once the effect is confirmed, copy to the next line. When selecting a system, check five things above all: traceable definitions, capture accuracy, usable manual entry, time alignment and report usability, so that the figures are trusted after go-live. Shanghai Chengxuan Intelligent provides solution design and development of equipment data acquisition, production visualization and efficiency statistics systems for machining, injection moulding, stamping and final assembly, with support for integration with MES and inspection systems and engineers available for direct contact.
Discuss your OEE efficiency plan
Tell us how many lines you have, which machine types are involved and how you count efficiency today, and we can advise on state capture, downtime attribution rules and report design for your site conditions. Engineers are available for direct contact.
Contact Us