What a machine data collection system actually manages
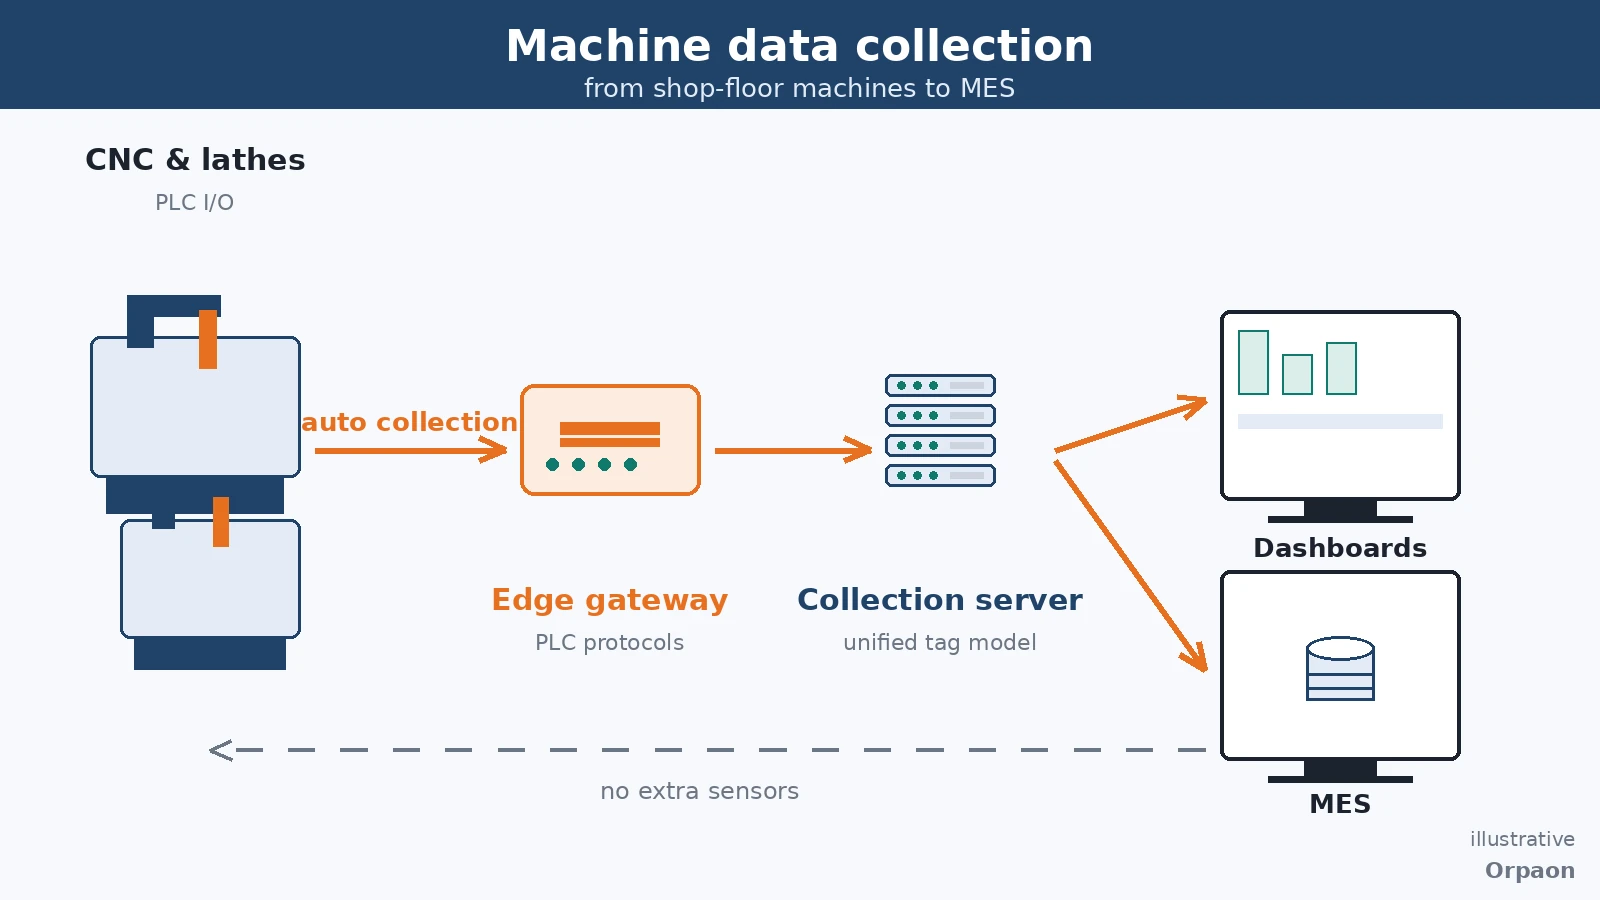
A machine data collection system automatically reads machine status, part counts, spindle load, alarms and process values from PLCs and CNC controls, and consolidates them into one consistently defined data foundation, so utilization and downtime reasons stop depending on manual logs and after-the-fact recollection.
Define the collection scope first: five data groups are the baseline
Most shops are not short of data — the data is scattered per machine. This lathe has counters, that machine only exposes alarms, and a third-party special-purpose machine opens none of its ports. The first job of a machine data collection system is to define the collection scope as an explicit data dictionary, so equipment of different ages and brands converges into one model.
Measured against the common needs of machining shops, five data groups are the baseline. Miss one, and a downstream calculation rule loses a leg:
- Status: running, idle, alarm and power-off states detected automatically — the basis of utilization calculations
- Counts: good-part and defect counters taken directly from the CNC or PLC, never retyped by hand
- Load: spindle load and feed override as continuous values, to catch overload and abnormal trends
- Alarms: codes recorded together with start and end timestamps, for failure-pattern analysis
- Process values: speed, feed, temperature and other key quantities, aligned with quality results
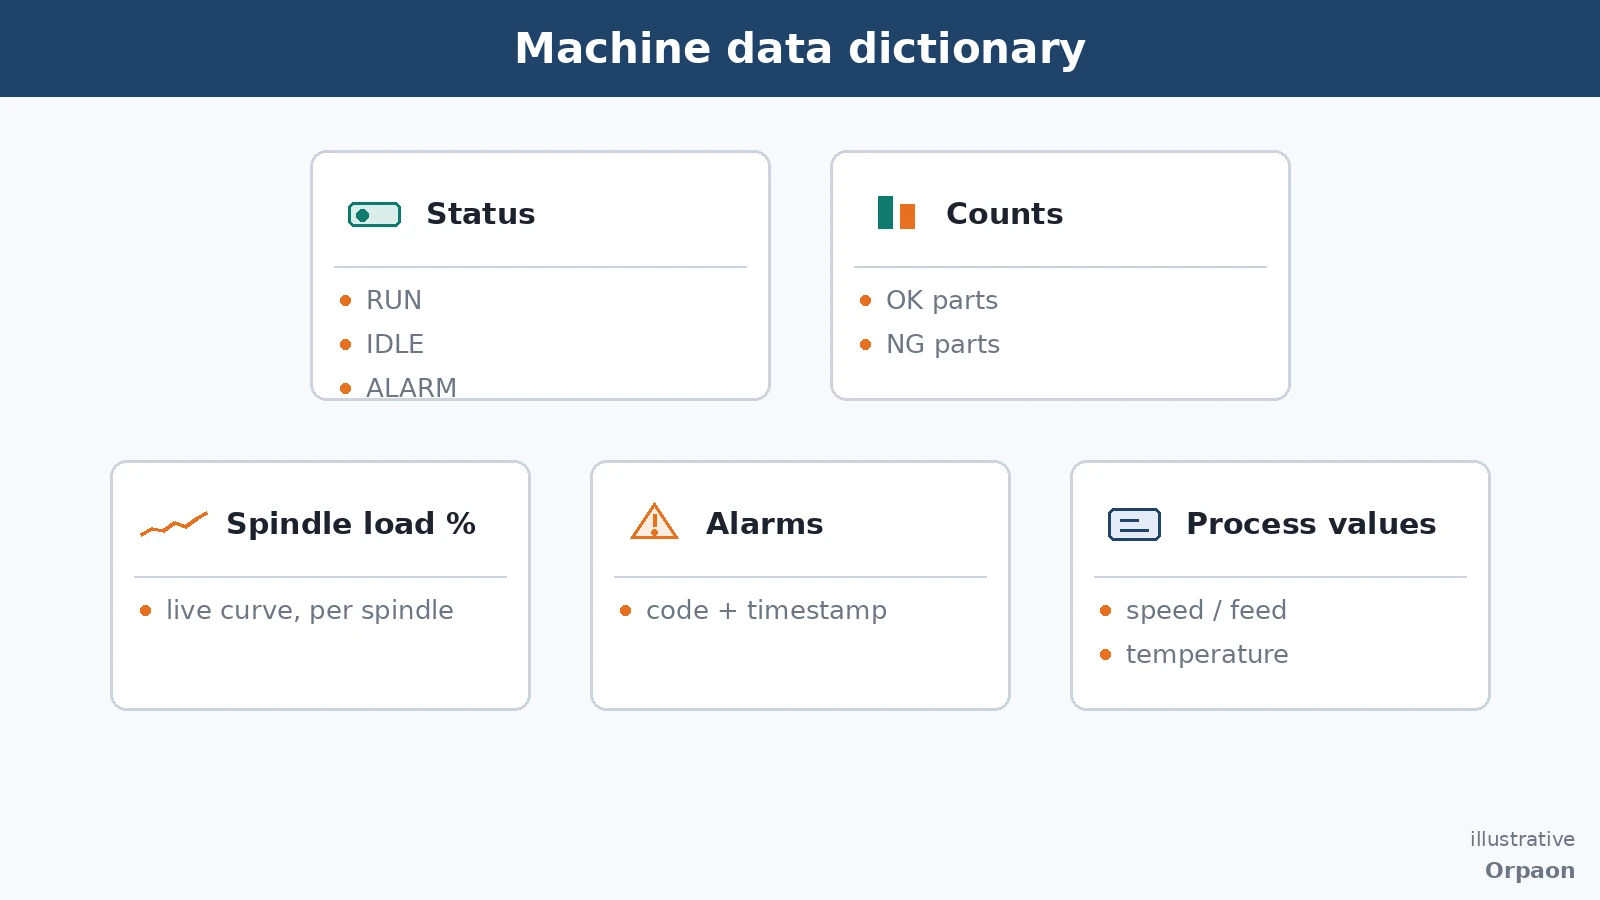
All five can be read directly from the equipment side. With protocol coverage across 20+ PLC brands — Mitsubishi MELSEC families, Siemens S7, Omron, Rockwell EtherNet/IP, Modbus RTU/TCP, PROFINET and OPC UA — most points need no additional sensors and no operator re-entry at a terminal. Whether data is generated automatically or assembled afterwards is decided right here.
Definitions come before dashboards: same data, different math, different conclusions
Collecting the data is only the first step; what makes reports credible is the calculation rules. The same running time yields a very different utilization figure depending on whether changeovers and material waits count in. Charging alarm downtime to equipment or to material changes who answers for it. Write the rules down first; the system's job is to execute them consistently.
A commonly used set of rules looks like this:
| Data item | Recording method | Typical use |
|---|---|---|
| Status time | Sampled per second, summarized per shift | Utilization, downtime attribution |
| Counts | Taken from NC/PLC counters, checked at shift end | Production reconciliation, yield |
| Alarms | Stored as code with start and end time | Failure frequency and pattern analysis |
| Process values | Stored as time series at a set cycle | Correlation with quality results |
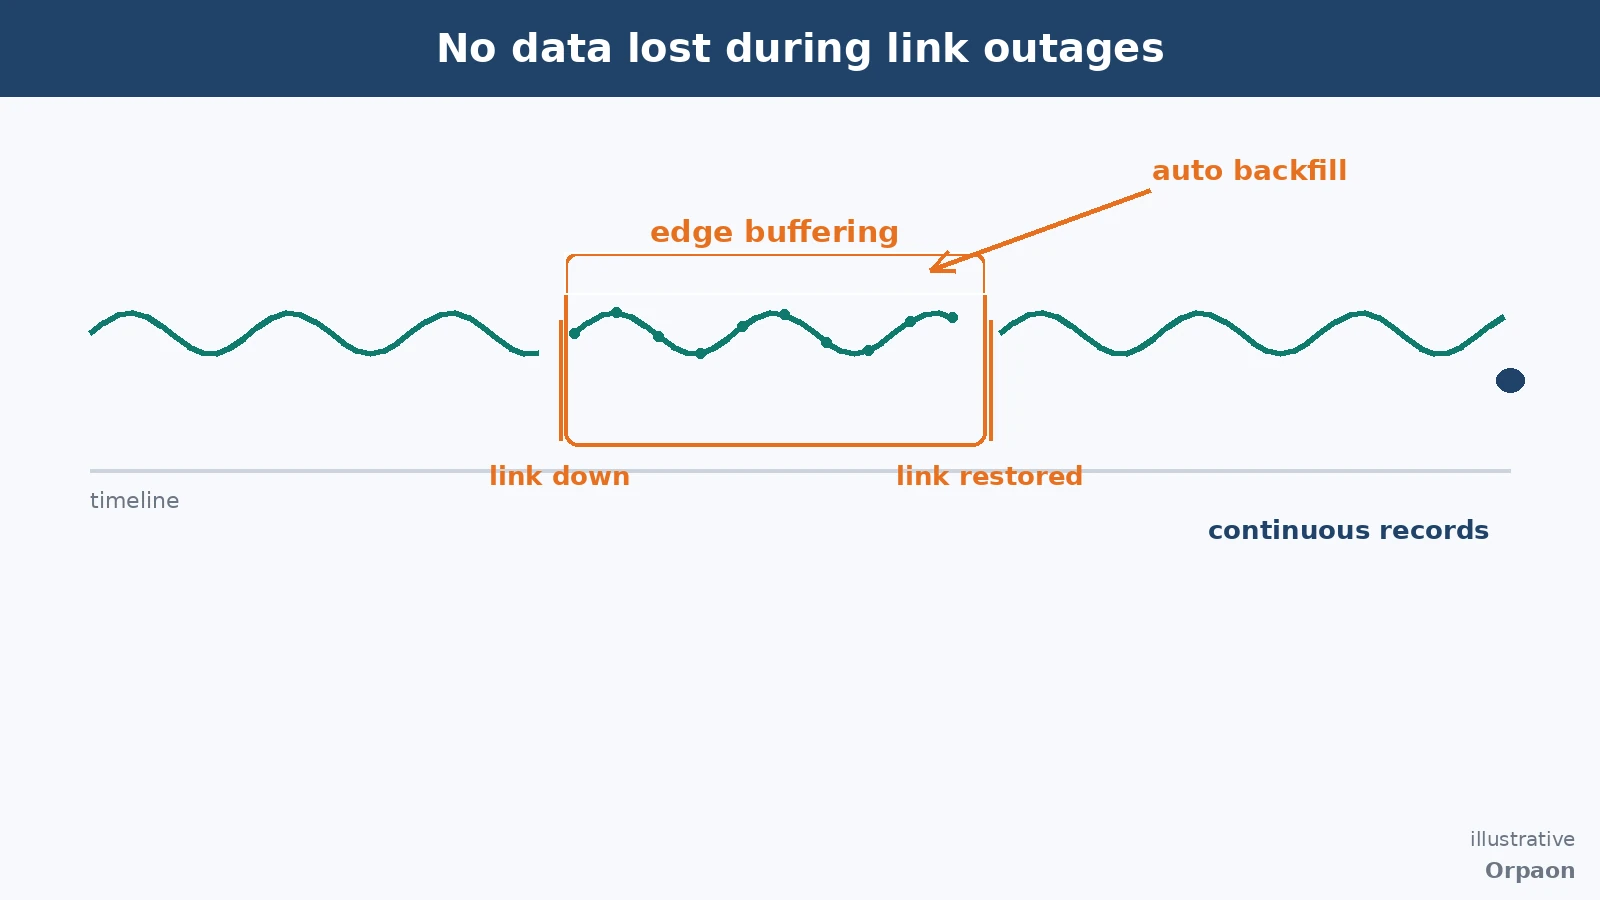
The collection path also has to survive network outages. Fluctuations on the shop network are routine: data buffers at the edge while the link is down and backfills automatically after recovery, so curves end up with no holes. Outage buffering and backfill is a capability that can be written into technical agreements and delivered against acceptance clauses — delivered projects include automatic backfill of process curves covering an outage window, passing acceptance. Uplink runs over MQTT plus REST as dual channels with certificate-level security, avoiding raw ports exposed to the public internet.
Five steps to go live: from point list to shift-ready
Rolling out a machine data collection system is not a single installation but a sequence of steps, each accepted machine by machine. In the right order, every step has a clear completion check:
- Inventory the points: list usable ports and protocols per machine from the equipment list; connect key machines first, then expand
- Fix the definitions: write status detection, count attribution and alarm classification rules into a rules document both sides confirm
- Build the channel: deploy gateways and the collection service, configure edge buffering and dual-channel uplink, verify backfill machine by machine
- Connect downstream: feed dashboards, reports and MES; unify field names and units in the data dictionary
- Run acceptance: trial per shift, check every report against the rules document, then hand over to shift use
These five steps have been repeated across delivered projects. ORPAON has focused on manufacturing digitalization since 2009; shop-floor data acquisition and multi-protocol access are delivered capabilities, with the rules document and data dictionary handed over with the project, so additional equipment joins the same model afterwards.
Summary
The value of a machine data collection system is not how many gateways were installed but whether its definitions survive scrutiny: how status is decided, whom a count belongs to, what happens when the network drops, and who the data feeds. Write these down and roll them out machine by machine, and the shop gains a trustworthy, expandable data foundation.
Book a consultation
Considering machine data collection for your shop floor? Book a consultation to review equipment interfaces and data definitions on site.
Contact Us