Factory Demand Charges: How to Find and Cut the Peak
To cut a factory demand charge, start with three things: pull the incoming feeder curve at the billing window, find the peak month by month, and list the loads that can wait half an hour. Hardware rarely needs replacing; once the measurement basis is agreed, the peak starts to move.
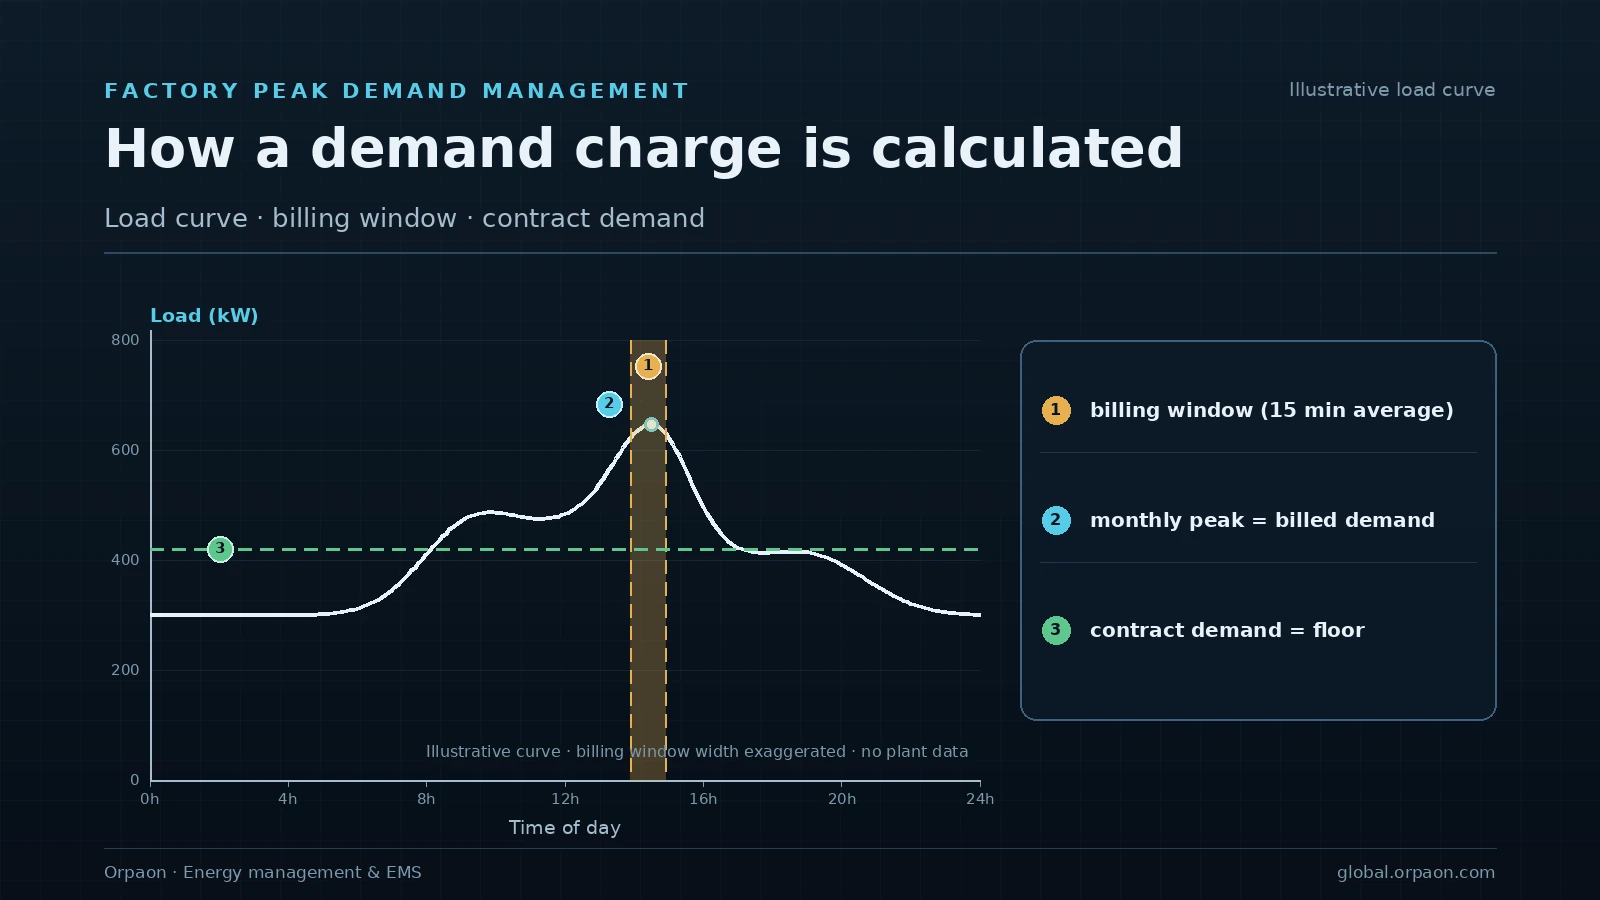
1. A demand charge is billed on power, not on energy
A demand charge is based on average power during a fixed window inside the billing period, not on the energy consumed. Window length, billing period and billing basis are defined by the local utility, so confirm those three items first. Optimizing before that check usually means optimizing the wrong number.
| Billing element | Common basis | What it changes on site |
|---|---|---|
| Window | 15 or 30 minute average active power | Short spikes still count, so inrush needs separate handling |
| Period | The monthly peak | One bad afternoon raises the whole month |
| Basis | Actual peak or contracted demand | A low contract value triggers overage charges, a high one pays a standing fee |
2. Where the peak comes from: list the shiftable loads
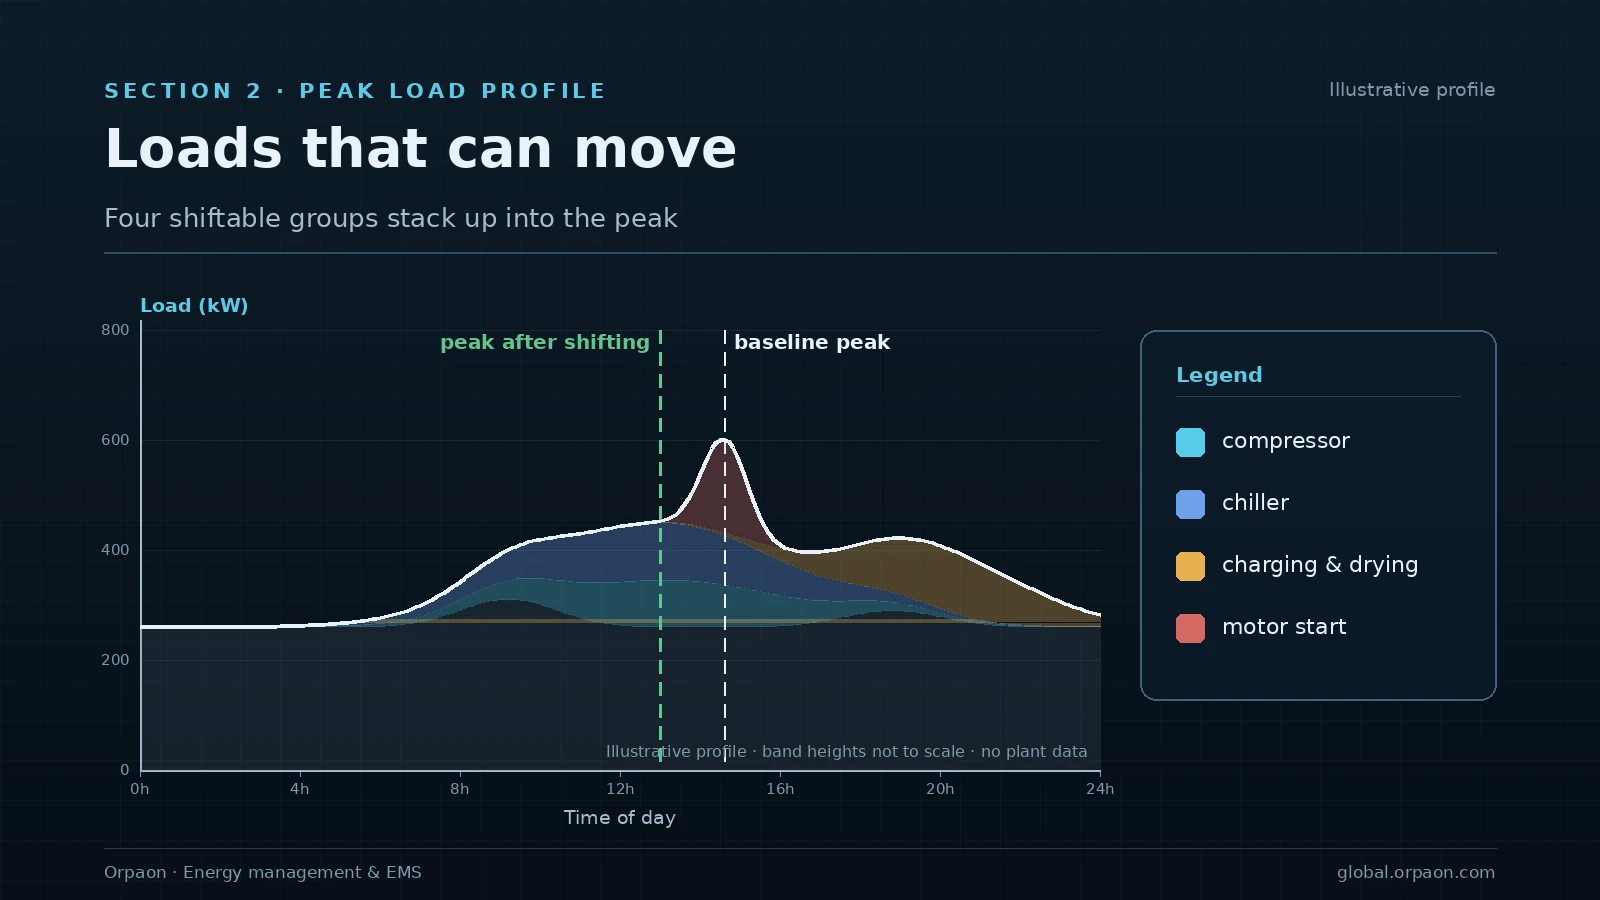
A plant peak is rarely caused by even consumption across the site. It usually comes from a few high-power loads landing in the same window. Sorting those loads by whether they can wait half an hour works better than asking every department to save energy.
- Compressors and chillers: loading curves can be staggered, and air receivers or chilled water storage absorb the step
- Charging, drying, ageing and test benches: most can be scheduled into off-peak hours
- Large motor starts: soft starters and staggered starts remove the inrush
- Non-critical lighting and office loads: can be switched off by shift
3. Write the control rules in three layers
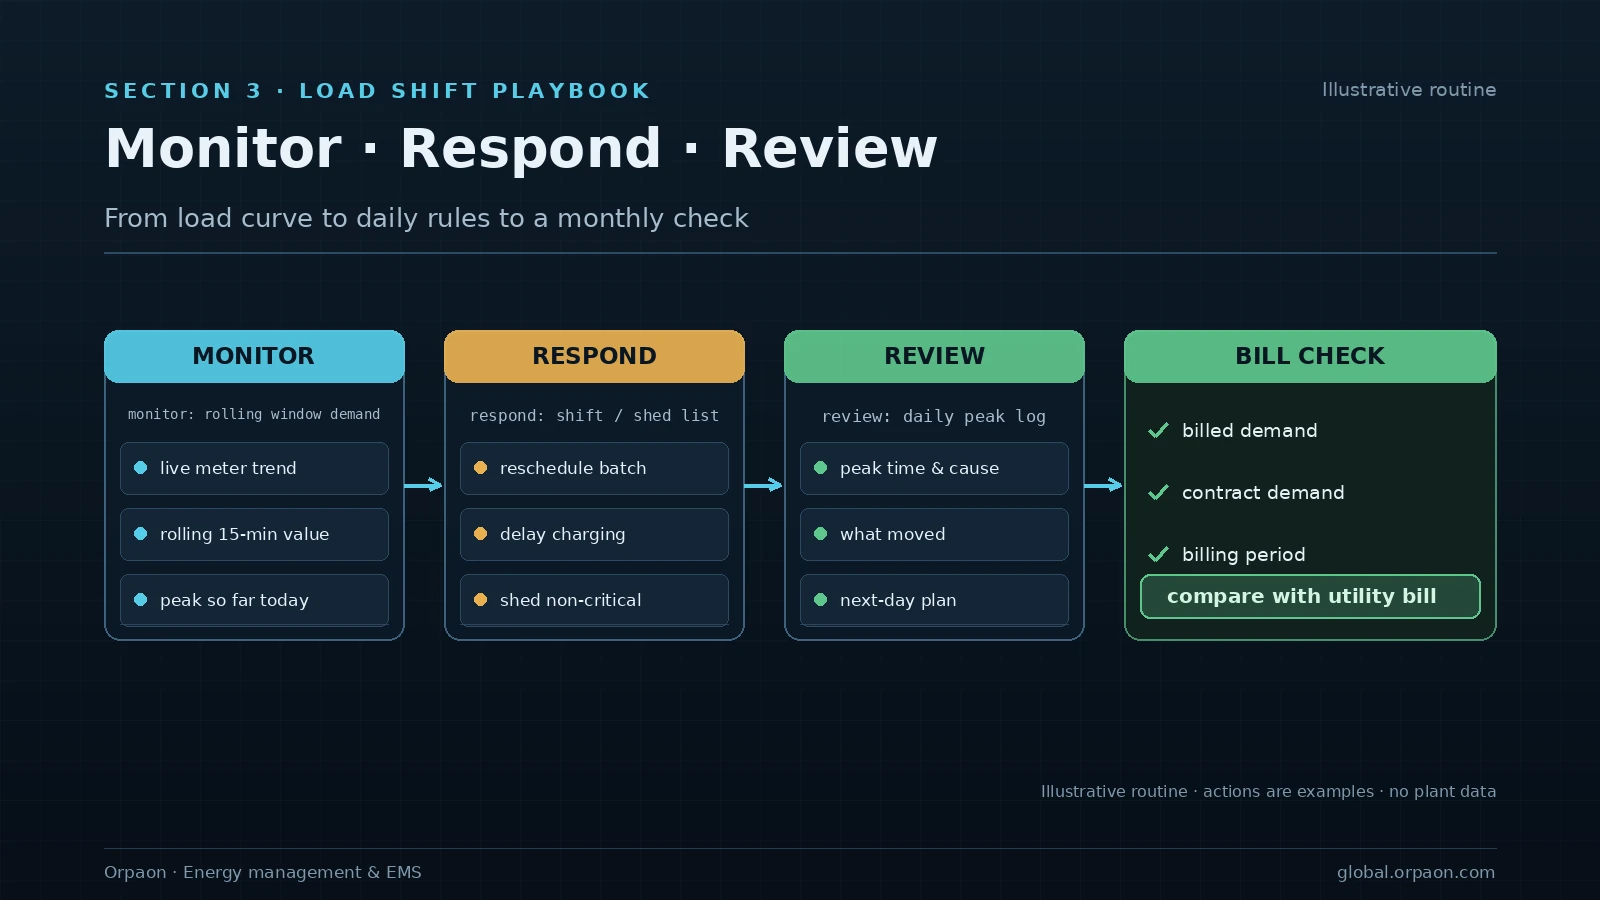
A curve without rules drifts back within weeks. The workable pattern is three layers, each with one job and one owner.
- Monitor: roll the billing window forward and warn before the threshold is reached
- Respond: run the shifting list, shedding interruptible loads first and moving shiftable loads second
- Review: keep a daily peak log and reconcile it with the utility bill at month end
4. Rollout order and acceptance
Start with one feeder. Connect the incoming meter and the main sub-meters, run a full billing period, then decide whether automated control is justified. The other order usually means buying controllers before the load profile is understood.
- Step one: incoming and main sub-meters connected, curve reconciles with the bill
- Step two: warning thresholds and a shifting list, executed manually
- Step three: hand repeatable actions to the system, keep human confirmation
Acceptance rests on three checks: the curve matches the bill, warnings arrive before the peak, and every intervention leaves a record.
Demand management is not load forecasting
Demand monitoring, warning and load shifting are deliverable and scoped per project. Load forecasting remains a research and joint-validation track, not a standard deliverable; where scheduling suggestions are involved, they stay advisory and are executed after human confirmation.
Request an on-site diagnosis
Send three months of utility bills and the incoming feeder curve; we map how the peak is formed under your tariff and return a shiftable-load action list.
Contact Us