Implementing an energy management system in plants
A manufacturing energy management system (EMS) turns electricity, water and gas consumption from a monthly utility bill into an asset that is continuously monitored, attributed line by line and improved on a fixed cycle; a durable EMS is built in four layers — metering, acquisition, platform and management — with submetering and an operating loop as its backbone.
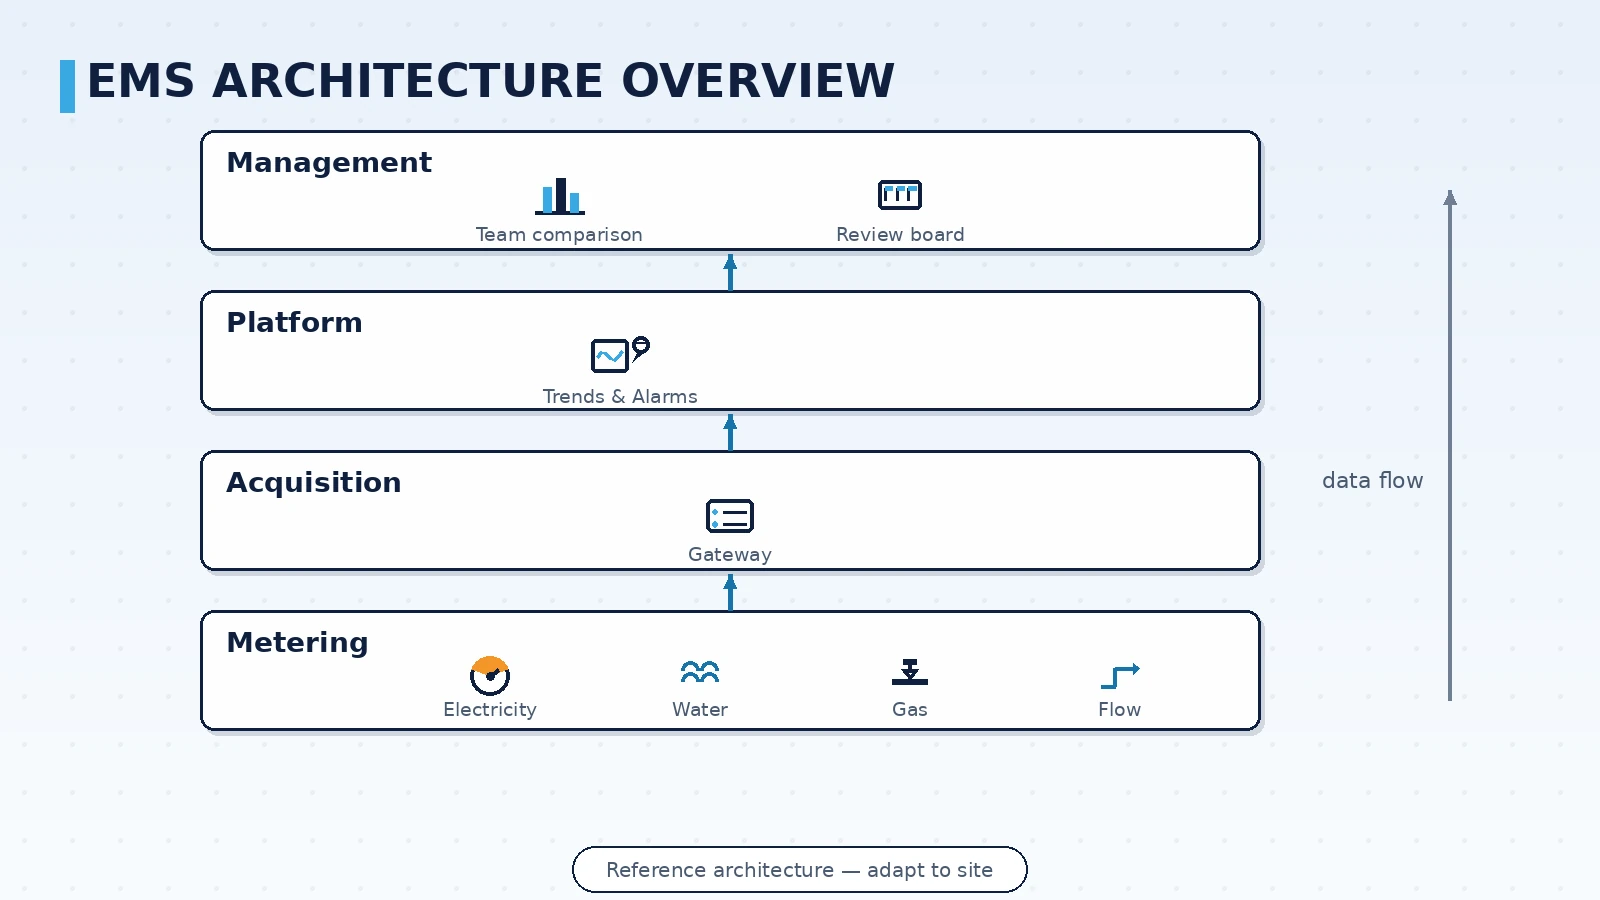
A four-layer reference architecture
Many plants picture an EMS as a single energy dashboard, then find the numbers do not match utility bills and no one can explain the variations — a few months later the dashboard goes unused. The usual cause is a missing layer: display without metering, or acquisition without management actions. A manufacturing EMS that stays in daily use can be understood as four layers, each with its own role:
- Metering layer: incoming main meters, submeter panels and water, gas and steam flow meters — they decide where data comes from and whether the scope matches billing
- Acquisition layer: gateways and collection programs read meters and PLCs on a fixed cycle, buffer locally during network outages and backfill afterwards so no data gap remains
- Platform layer: time-series storage, energy statistics, submetering and per-unit calculations, automatic alerts — turning raw readings into comparable indicators
- Management layer: shift-to-shift comparisons, before-and-after evaluation of efficiency projects, audit and certification support — putting the indicators into daily management
The four layers are independent yet constrain each other: metering defines the scope, acquisition defines completeness, the platform defines comparability, and the management layer decides whether anyone uses the data. Checking a vendor's delivery scope layer by layer predicts real performance after go-live better than a feature list does.
Where to place submeters: from the main meter down to equipment
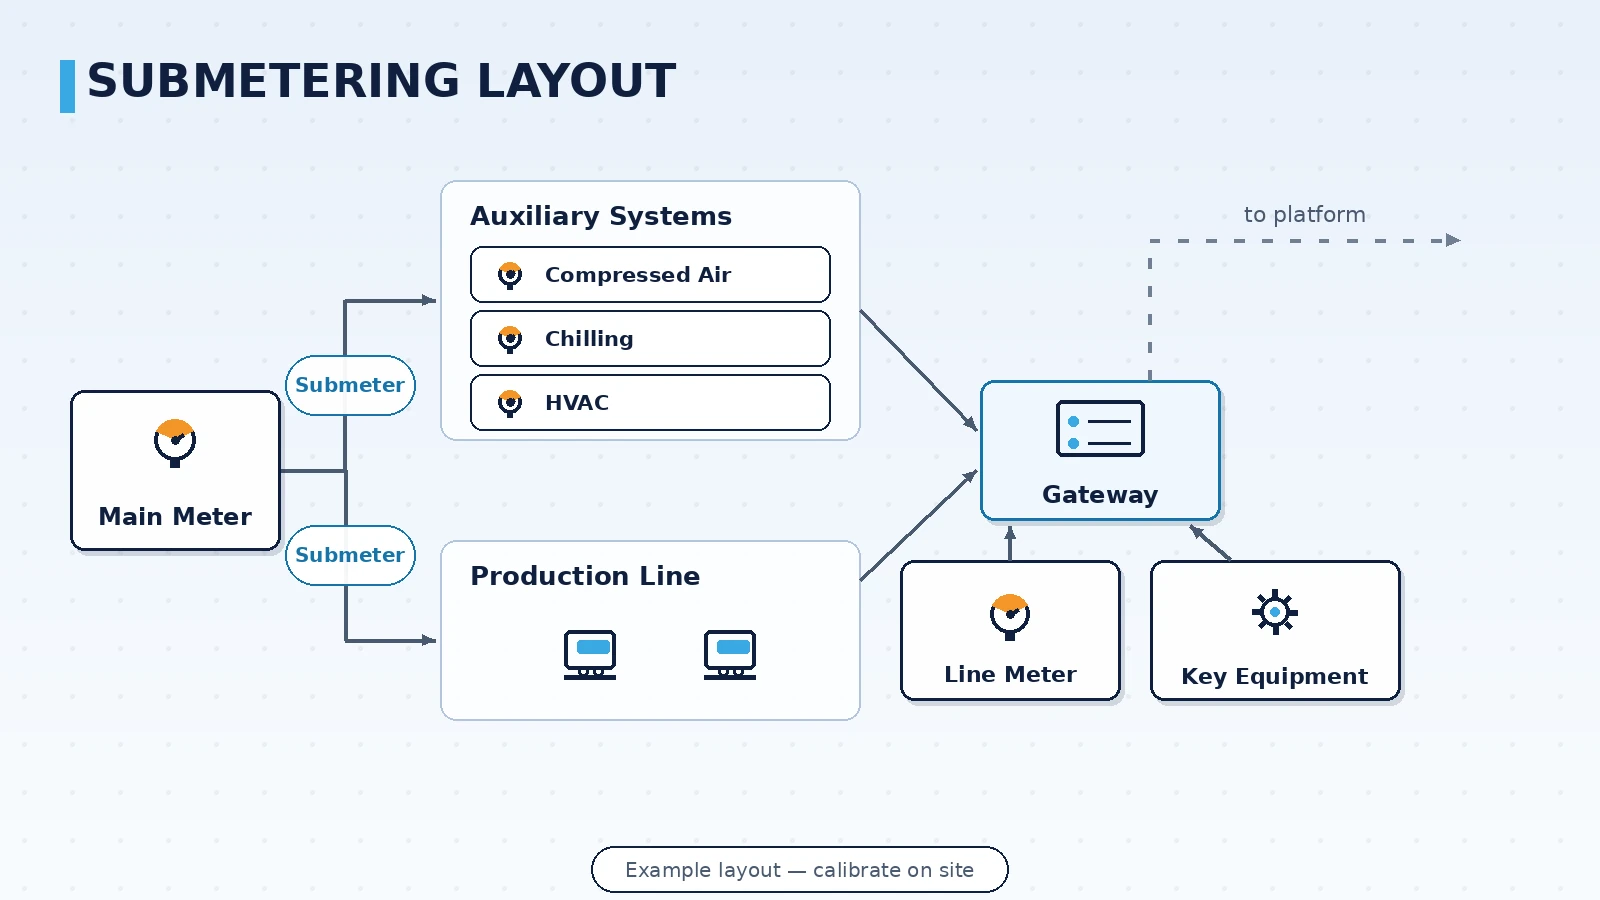
In a plant with only an incoming main meter, energy data reduces to "utility bill divided by months" — it locates nothing and evaluates no efficiency project. The rollout principle is layer by layer: align with billing first, then expand by system and equipment so every kilowatt-hour lands in an accountable unit. A typical sequence:
- Meter the incoming supply and main feeders first, aligning with the utility billing scope to set a plant-wide baseline
- Submeter auxiliary systems — compressed air, chilling, purified water, HVAC — and account for them separately from production energy
- Install line-level meters on main production lines to build comparable units by workshop or process section
- Connect high-consumption equipment (compressors, chiller units, large heat-treatment lines) individually to capture start-stop and standby losses
- Aggregate automatically per shift and push anomalies to the responsible team instead of waiting for a month-end report
Orpaon delivers this chain in its energy management EMS practice using utility submetering plus benchmarking analysis; the acquisition side supports buffering and backfill during network outages, so no data gap remains. For overseas plants, projects are run by engineers with English-speaking project experience from scoping through meter verification to acceptance — communication does not depend on a third-party translation step.
Building the operating loop
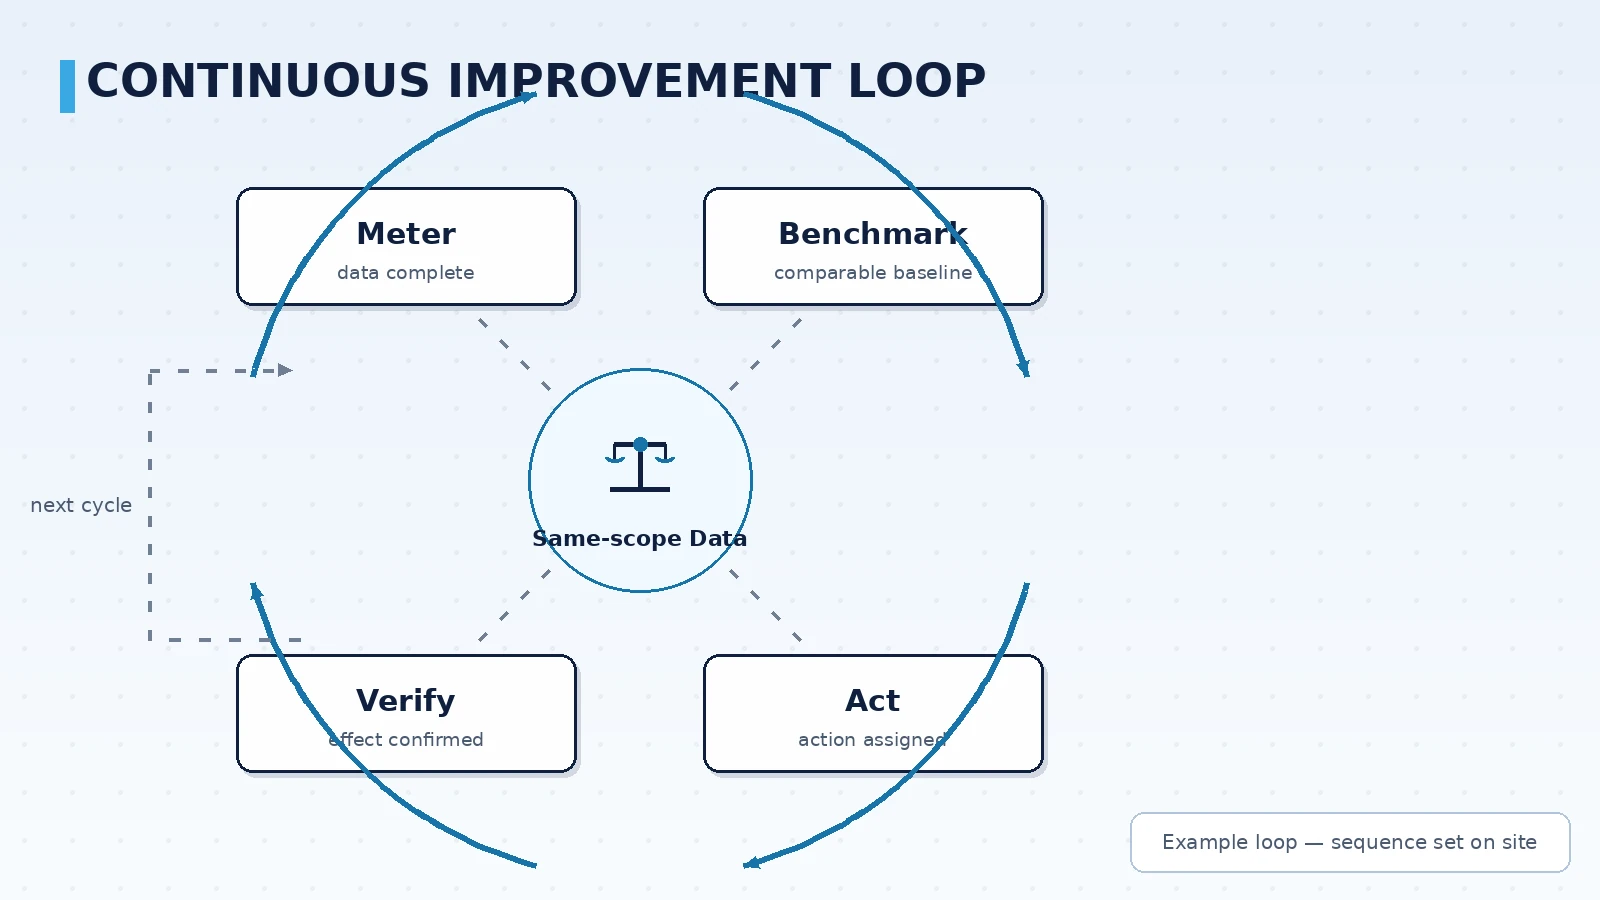
Go-live is only the starting point: whether consumption keeps falling depends on a management loop that runs on a fixed cycle. The four steps are simple; what matters is that each has an owner and a completion criterion:
| Step | What is done | Completion criterion |
|---|---|---|
| Meter | Verify submeter totals against the billing scope | Deviation between submeter sum and main meter stays within the agreed range |
| Benchmark | Compare shifts, periods and specific energy consumption | Generated automatically per shift, with no manual aggregation |
| Act | Schedule operational adjustments or upgrades for the largest deviations | Every measure has an owner and an expected direction |
| Verify | Confirm actual effect with same-scope before/after data | The comparison enters the shift or monthly review |
Globally, industry accounts for roughly one third of final energy consumption (IEA, 2023), and sectors where energy weighs heavily in cost — textiles, food, electronics, chemicals — are the most sensitive to specific consumption. ISO 50001:2018 places energy performance indicators (EnPIs) at the core of the management system, and an EMS is precisely the tool that turns EnPIs from quarterly reports into per-shift online indicators. With continuous same-scope data, investment decisions for efficiency projects rest on measured comparisons rather than estimates.
Orpaon has focused on manufacturing digitalization since 2009. Energy management EMS is a delivered capability: from incoming metering and submeter placement through buffered acquisition to statistics and benchmarking platforms, plus extended directions such as storage EMS and PV-storage energy management.
Summary
The value of a manufacturing EMS lies not in the dashboard but in whether the four layers are complete: metering defines the scope, acquisition preserves completeness, the platform produces comparable indicators, and the management loop keeps them in use. Orpaon delivers the full EMS chain from submetering to benchmarking platforms — book a site diagnosis to discuss a rollout plan based on your plant's current metering coverage.
Request a site diagnosis
An engineer will review your metering coverage, submetering scope and platform boundaries with you, and discuss an EMS architecture and rollout sequence that fits the plant. An English-speaking contact is available for overseas plants.
Contact Us