How to calculate and reduce energy consumption per unit
Energy consumption per unit of product is total energy consumed in a period divided by the number of good units produced in the same period; it answers the question of how much energy each product takes to make. To make the number genuinely fall rather than merely look better on a report, you need a consistent calculation boundary, metering coverage of key sub-systems and equipment, and automatic alignment of output with energy at batch level.
What unit energy consumption is: define the boundary first
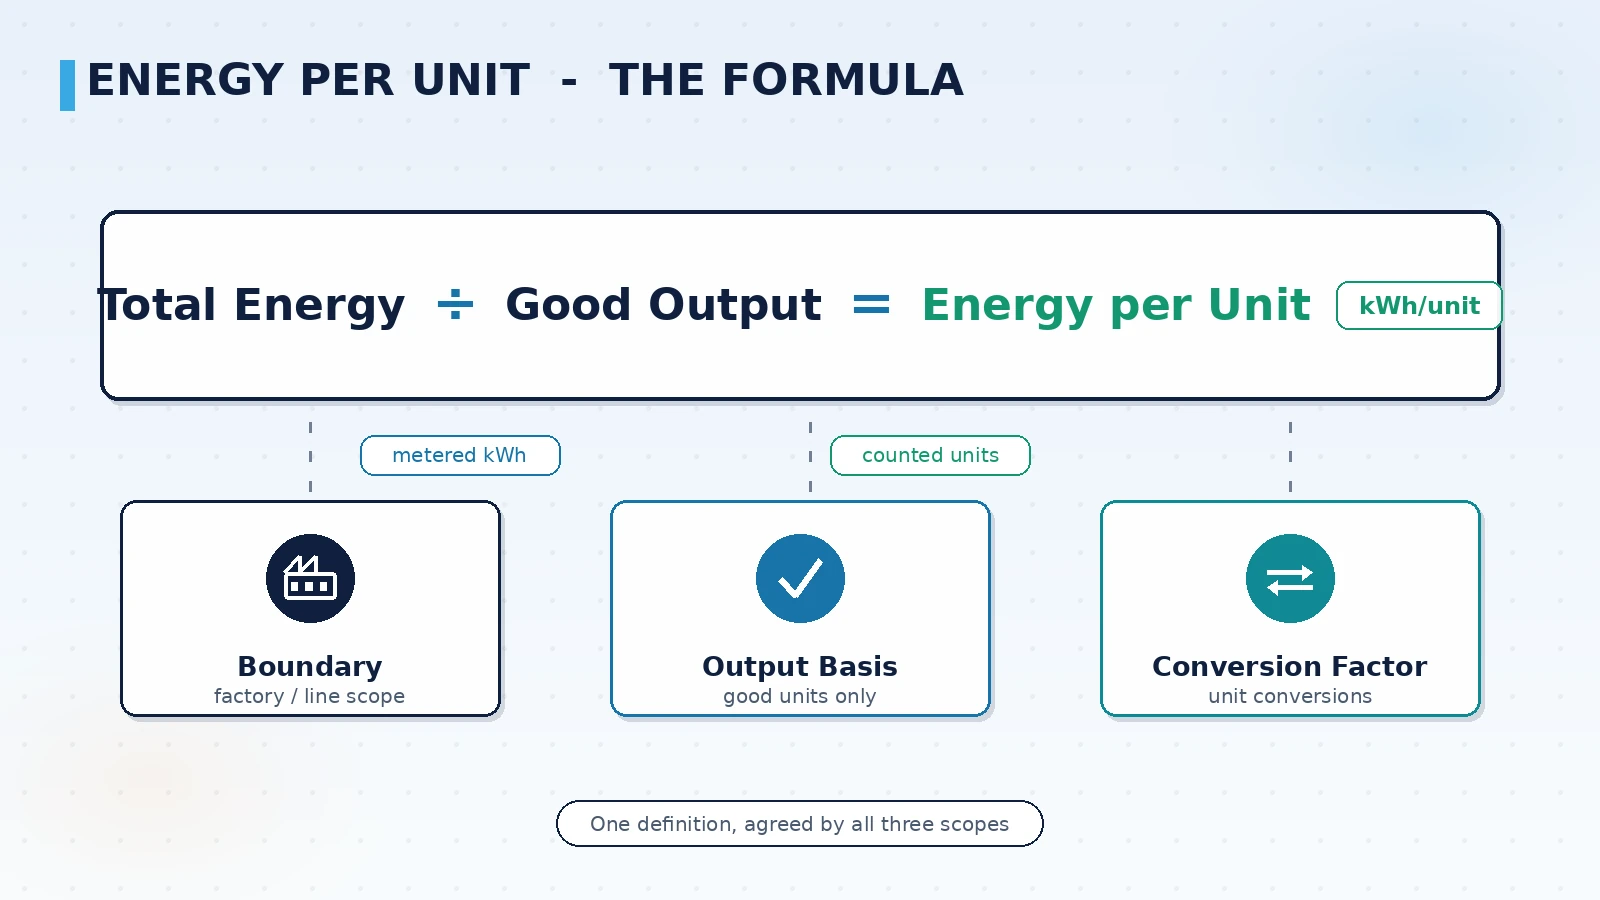
The formula is simple: unit consumption = total energy in the period ÷ good output in the same period. What is difficult is not the formula but the boundary — which consumption is counted, on what basis output is measured, and how different energy carriers are converted. If these three are not fixed, the number loses comparability. ISO 50001:2018 treats energy performance indicators (EnPIs) as a core method of energy management systems, and unit energy consumption is one of the EnPIs most widely used in manufacturing (ISO 50001, 2018).
- Boundary: whether the unit is a workshop, a line or the whole plant; whether auxiliary systems such as compressed air, chilling and purified water sit inside the main process or are reported separately.
- Output basis: whether output is counted as good units or total units off the line; how multi-product lines are converted into a standard output figure.
- Energy conversion: electricity, natural gas, steam and compressed air converted into one common unit, with conversion factors fixed and kept on record.
Once defined, the boundary should not change often. When it must change — a new line, an outsourced process — the system should keep versions of the boundary and display historical curves under the old one, so figures stay comparable over time.
From the main meter to the batch: building the data path
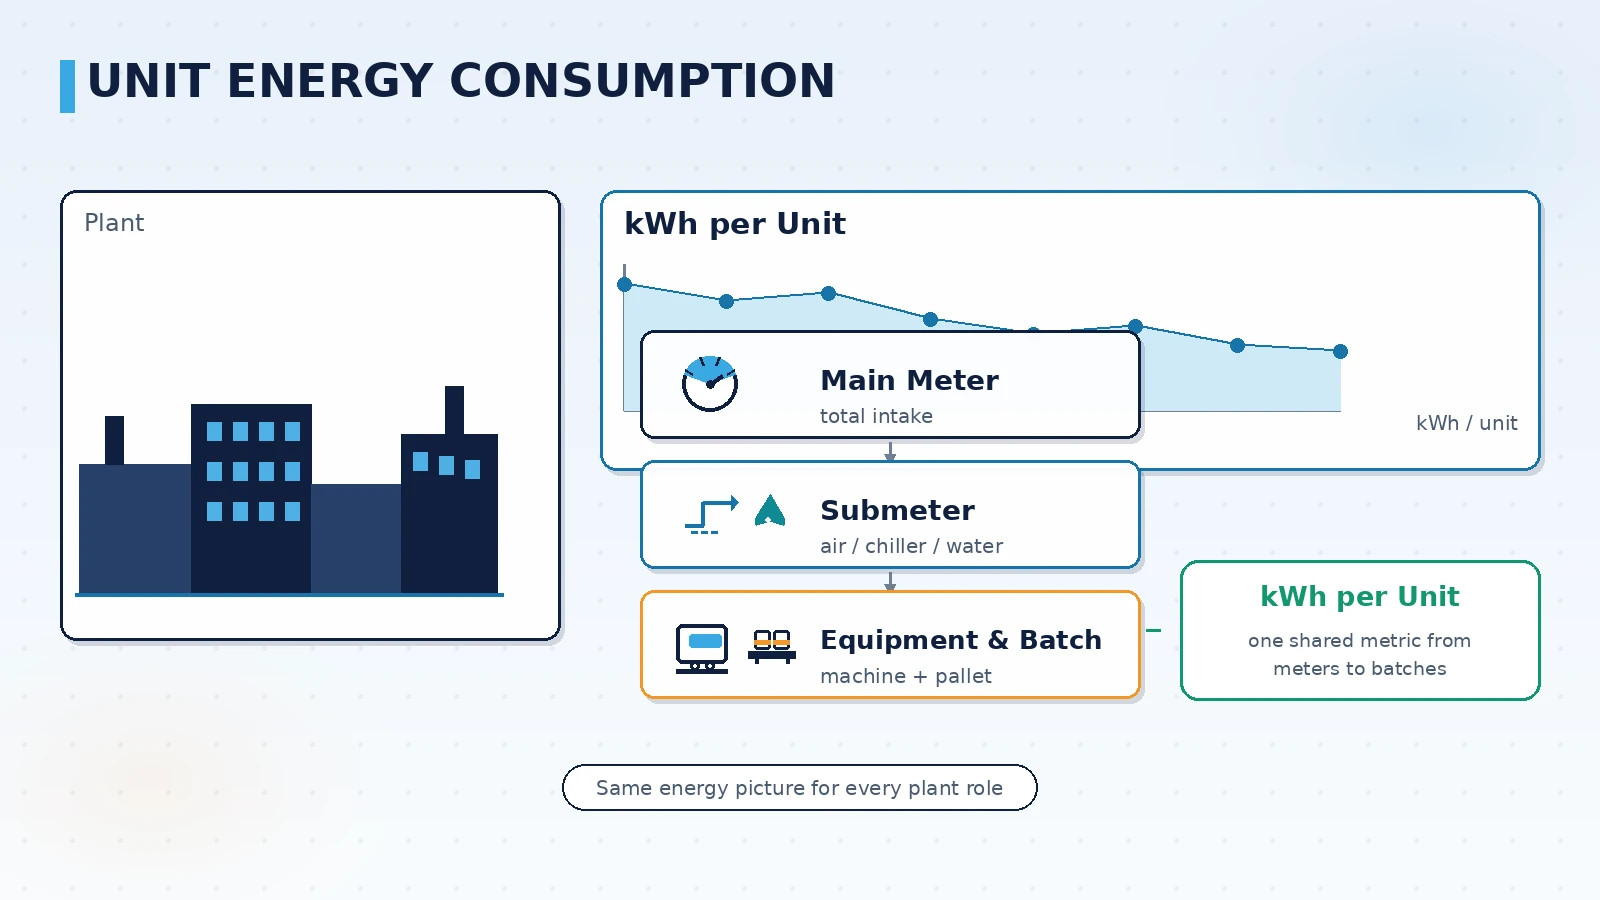
Many plants rely on the incoming main meter alone, so the figure at hand is the electricity bill divided by monthly output — a plant-wide number diluted by office and non-production loads, with no way to attribute its variation. For unit consumption to support root-cause analysis, metering must be layered: the main meter shows cost, submeters show systems, equipment and batches show causes.
- Meter the incoming supply and its feeders so figures align with the utility billing structure.
- Submeter auxiliary systems — compressed air, chilling, purified water — and account for their energy separately.
- Install line-level power meters on main production lines; meter steam, gas and compressed air by flow.
- Connect key equipment to acquisition gateways and align energy with output automatically per shift and per batch.
- Let the platform compute unit consumption per batch automatically and push abnormal deviations to the responsible crew.
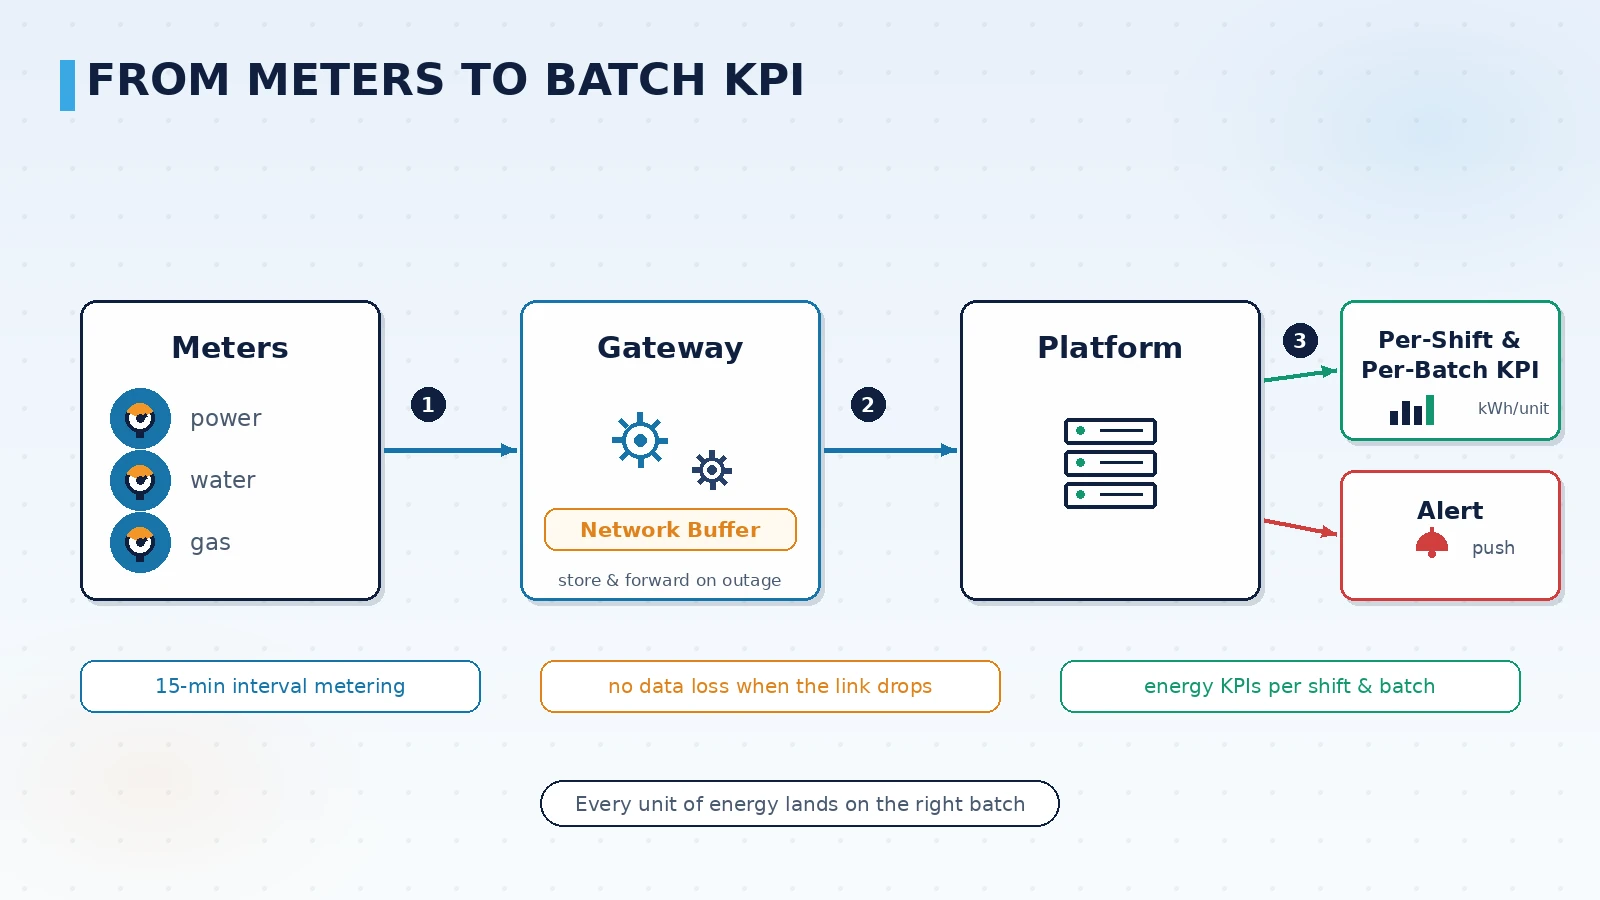
Once the path is connected, unit consumption changes from a monthly after-the-fact report into a per-shift online indicator. In its energy management EMS practice, Shanghai Orangexuan delivers this path through water-electricity-gas submetering combined with batch-level aggregation; the acquisition layer buffers data during network outages and backfills it afterwards, so interruptions do not lose records. Overseas plant projects are carried by an English-speaking contact from requirement reviews through to acceptance.
Three levers that cut unit consumption
The value of the indicator is that it directs action. Levers fall into three classes by how they take effect: operational adjustments need no capital and work quickly; equipment and process upgrades lower the inherent unit consumption; management routines keep the reduction in place instead of letting it creep back.
| Lever class | Typical actions | How it takes effect |
|---|---|---|
| Operational adjustment | Shifting production between tariff periods, cutting standby load, tuning compressor loading and unloading | No new investment; executable within a shift |
| Equipment and process | High-efficiency motors and variable-speed drives, heat recovery, group control of chilling plants | Lowers inherent unit consumption; benefits persist after the upgrade |
| Management routine | Crew-level benchmarking of unit consumption, inclusion in handovers and monthly reviews, automatic alerts on deviations | Stops the indicator from creeping back; sustains improvement |
Globally, industry accounts for roughly one third of final energy consumption (IEA, 2023), and sectors where energy is a large share of cost — general manufacturing segments such as textiles, food and electronics — are the most sensitive to changes in unit consumption. With a batch-level baseline in place, before-and-after comparisons of an upgrade are measured on the same boundary, so investment decisions rest on measured figures rather than estimates.
Summary
For unit energy consumption to be usable as a management tool, three things must be solid: a consistent boundary for comparability, layered metering for attribution, and batch alignment for accountability. Shanghai Orangexuan delivers the complete path from submetering to a batch-level unit-consumption platform. Book a site diagnosis and we will discuss a calculation scheme and an improvement path based on the current state of your lines.
Request a Site Diagnosis
An engineer will review the calculation boundary, the submetering scope and the batch alignment scheme together with you, and discuss the unit-consumption baseline and the order in which the three levers should be applied. An English-speaking contact supports the project throughout, including overseas plant coordination.
Contact Us