What a Compressed Air Energy Monitoring System Does
A compressed air energy monitoring system solves a concrete problem: metering the right parameters, placing meters at the right points, calculating specific energy per cubic meter, and giving leak management and compressor operation strategies a data basis. This article sets out a practical sequence in five steps, starting with why compressed air deserves its own monitoring.
Why compressed air deserves its own monitoring
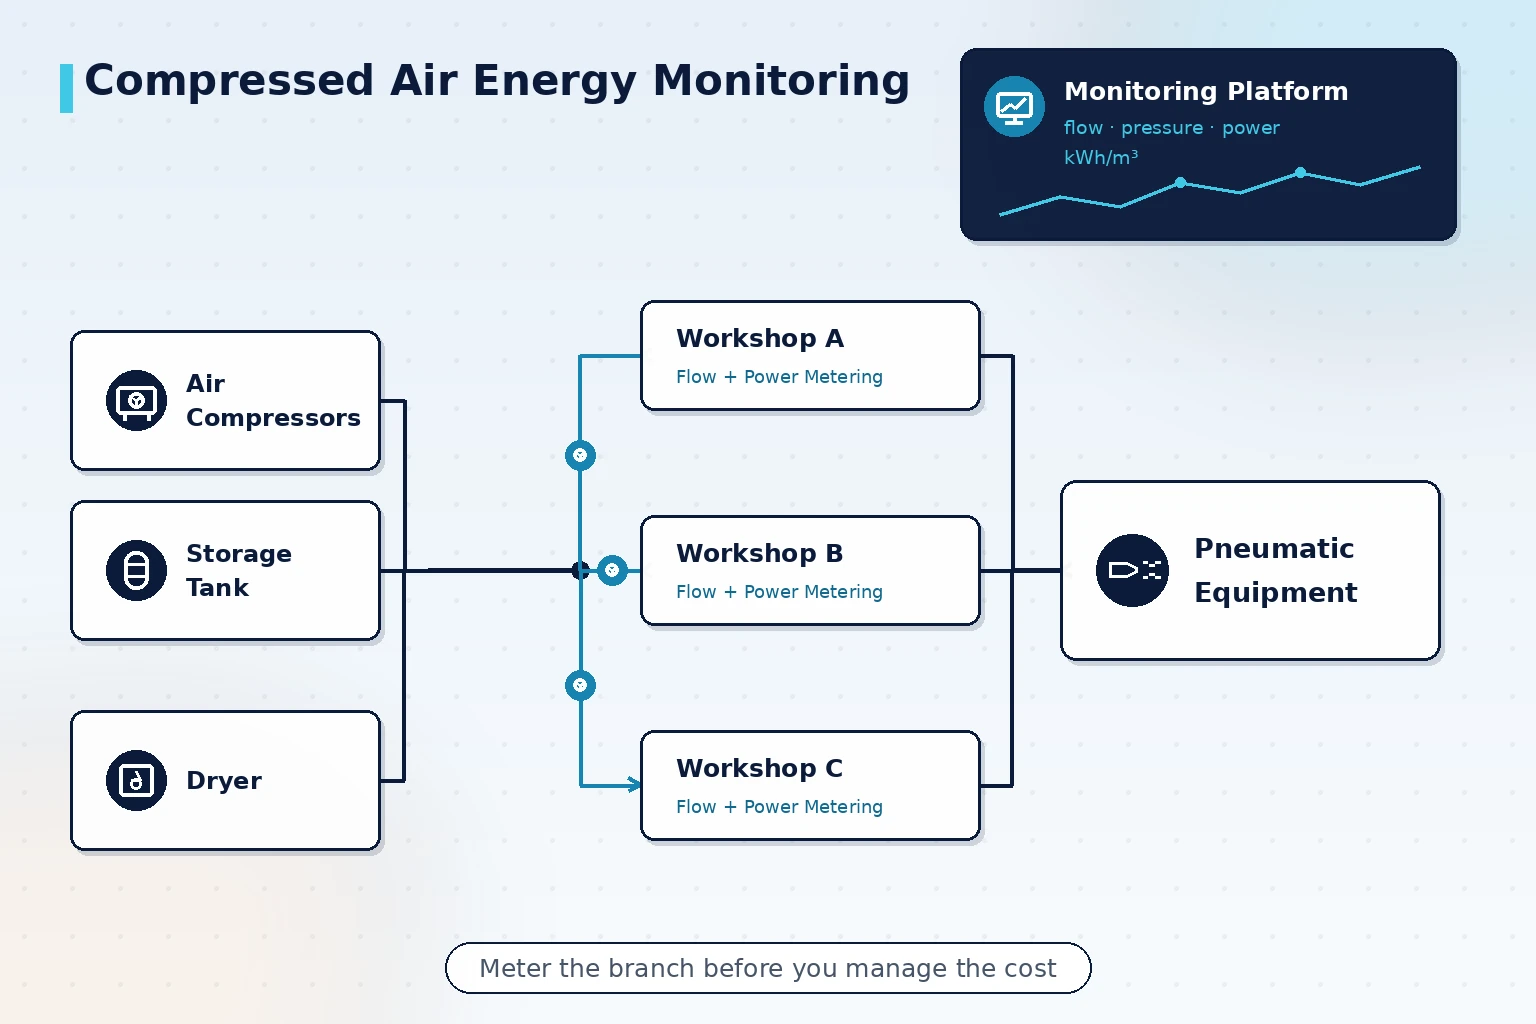
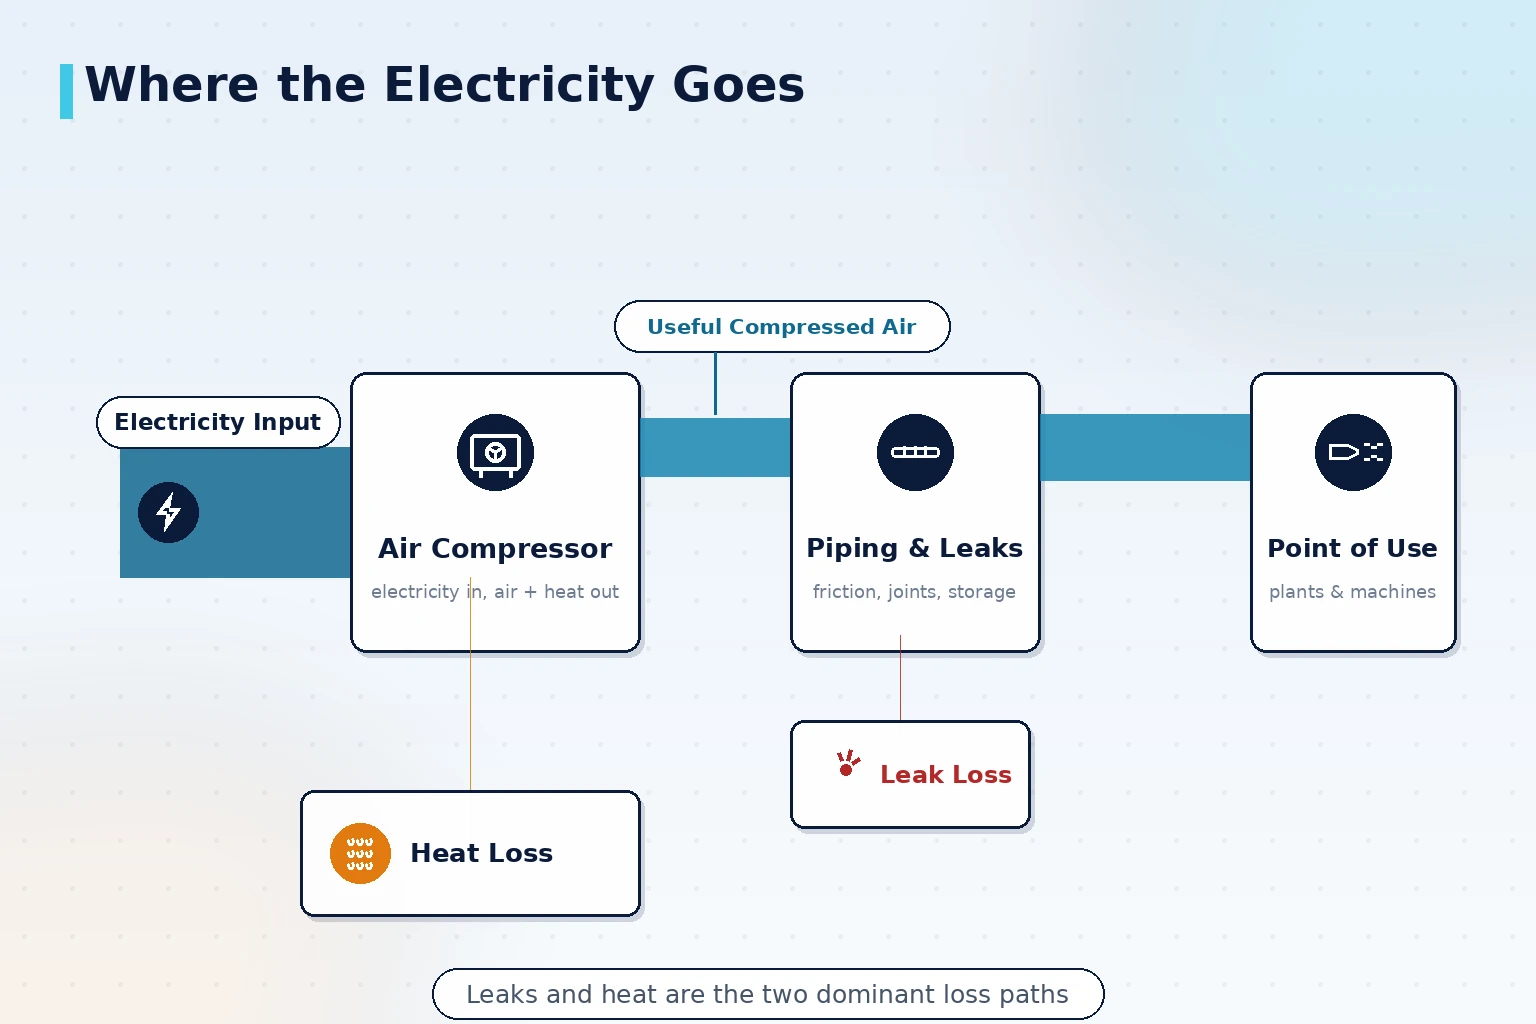
Compressed air justifies separate monitoring because of its large share of electricity use, its many loss paths, and the way air consumption is scattered across workshops. Four points stand out:
- A large share of electricity: the compressor plant is usually among the largest connected loads in a factory, running around the clock, and it shows on the electricity bill.
- Many loss paths: leaks, long idle running, supply pressure set too high and poorly chosen dryer regeneration all shrink the amount of air actually available.
- Consumers are scattered: several workshop branches share one air supply, and without sub-metering nobody can say who used how much.
- Responsibility is hard to align: electricity is allocated on a plant-wide meter, so specific energy never gets tied to the units that consume the air, and improvement actions lack a basis.
What to measure: five parameter groups
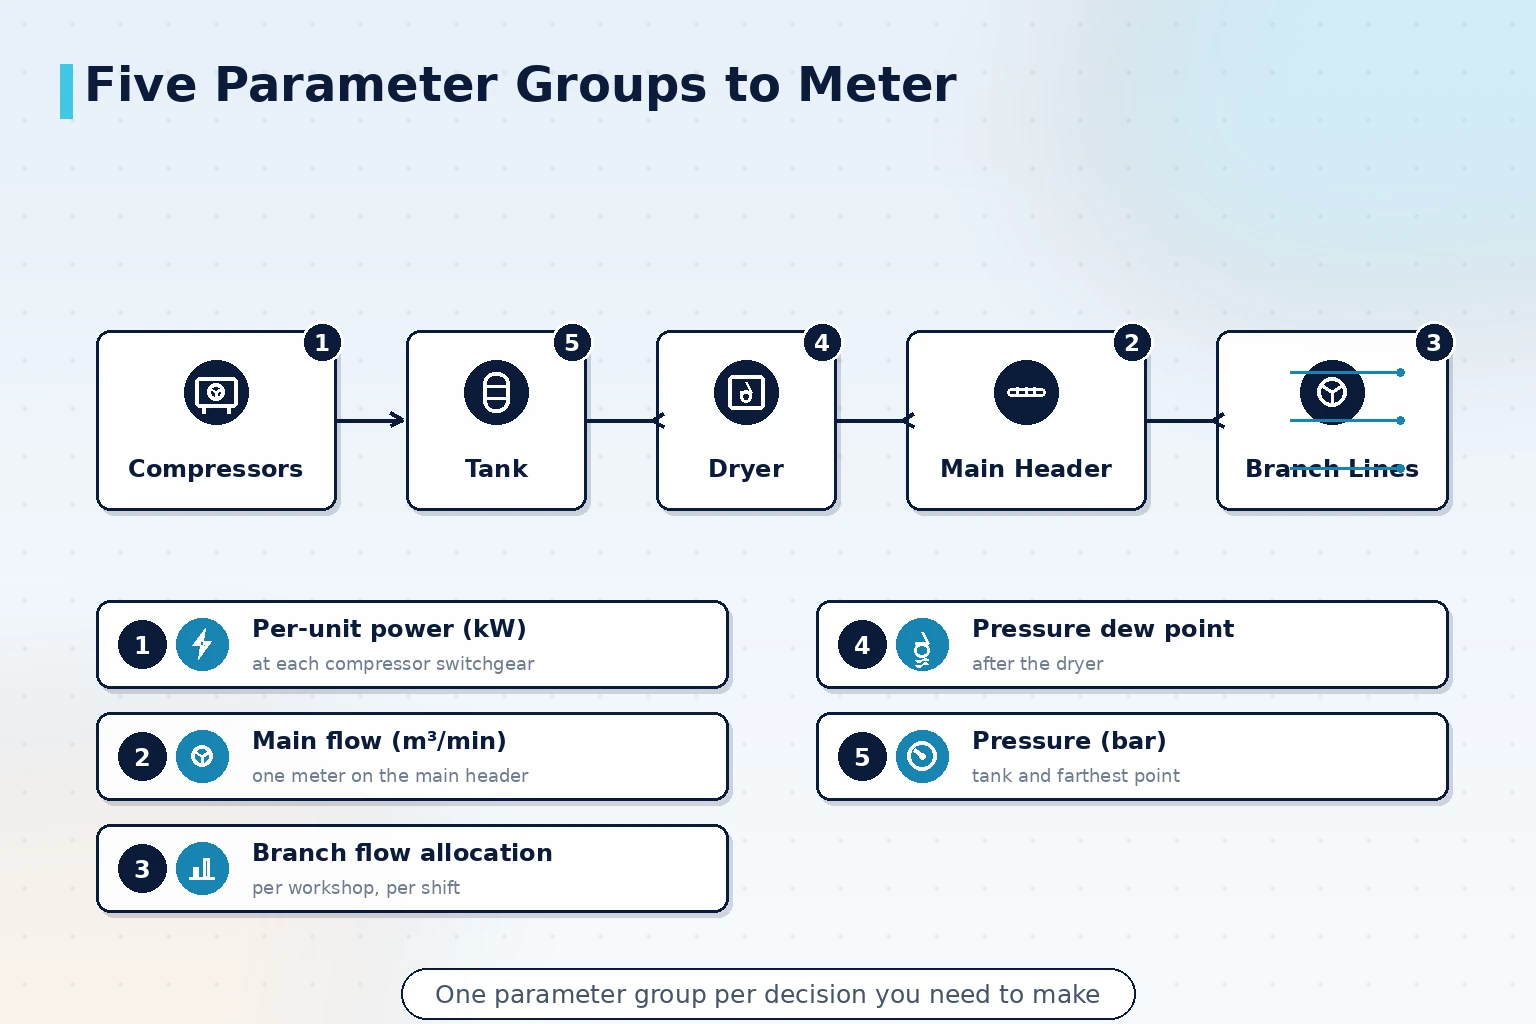
You do not need many parameters; you need each group to answer one management question. Start with these five:
| Parameter group | Typical measuring points | The question it answers |
|---|---|---|
| Power and energy | Compressor distribution cabinets, dryer circuits | How much electricity each unit uses, and how long it spends loaded versus unloaded |
| Flow | Main header after the storage tank, workshop branches | How much air is produced in total, and how much each branch takes |
| Pressure | Storage tank, points of use | Whether supply pressure is set too high, and where the pressure drop happens |
| Dew point | Dryer outlet | Whether drying quality is adequate, and whether regeneration air use is abnormal |
| Operating status | Load/unload signals, discharge temperature | Whether loading cycles too often, and whether any unit idles for long periods |
How to place sub-meters
Work from the main header down to the branches: see the total first, then split it by unit.
- The main header is mandatory: flow at the main header after the storage tank is the plant-wide baseline for produced and consumed air, and the specific energy indicator starts from this data.
- Split branches by unit: install branch flow meters along workshop, line or cost-center boundaries so every consumer has its own account.
- Verify large consumers separately: for units with dense pneumatic equipment or continuous demand, check flow and operating conditions individually so anomalies are visible at once.
- Keep meter records: file the model, range, accuracy and calibration records of flow meters and power meters, so the data basis holds up.
How to calculate and use specific energy
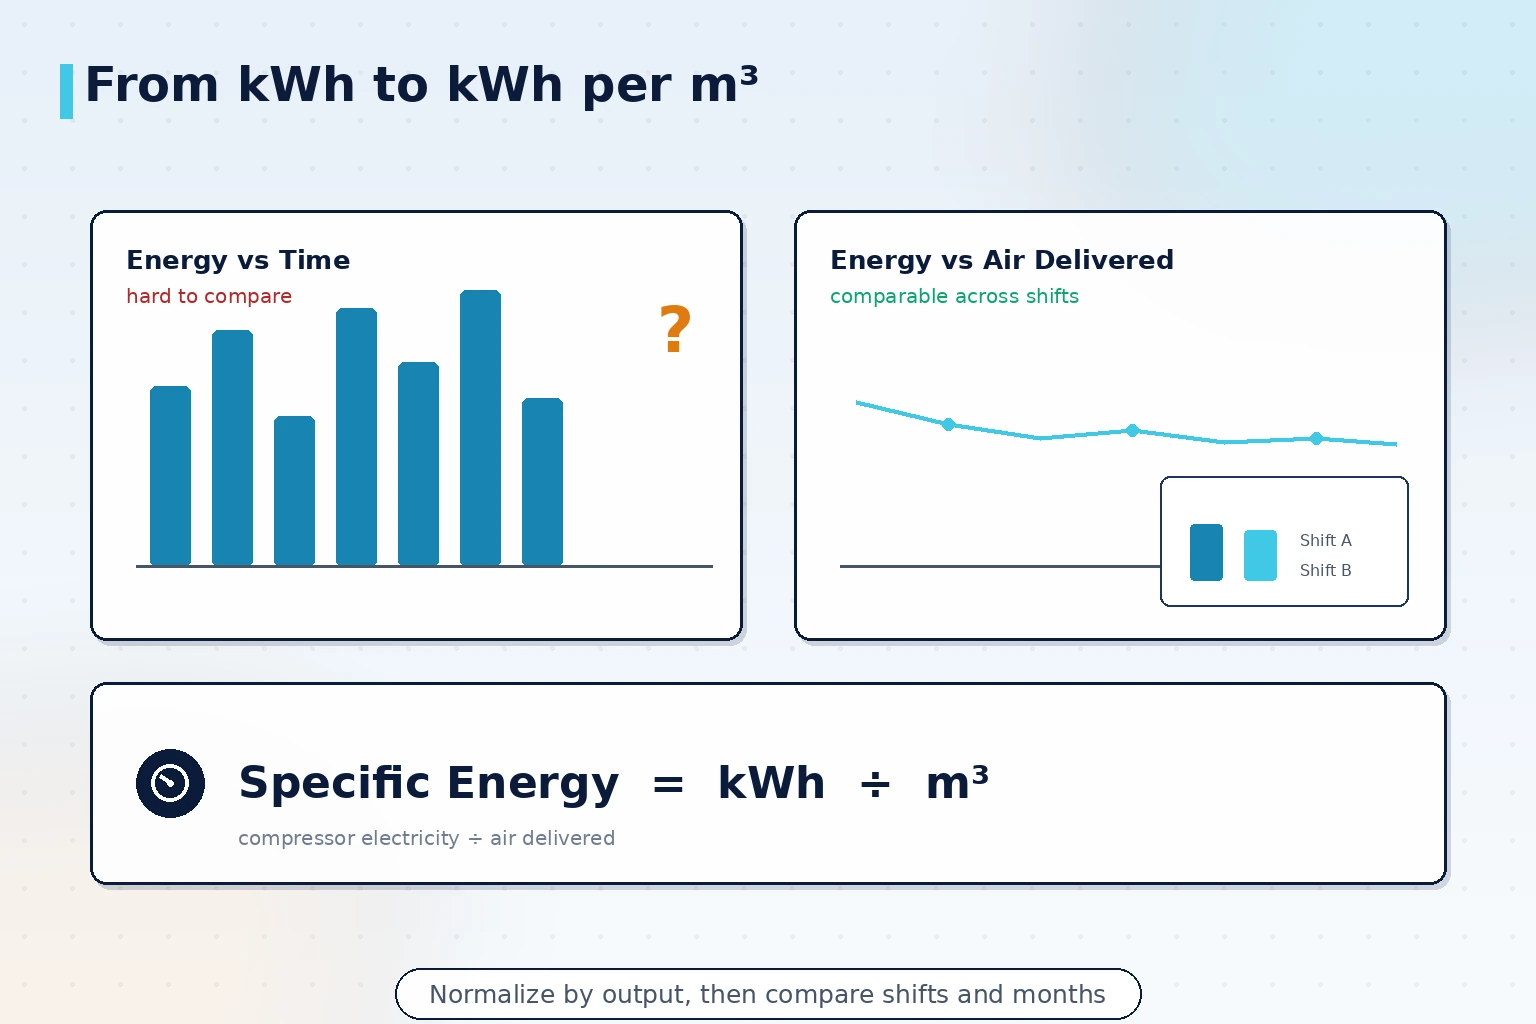
Specific energy turns "how much electricity did we use" into "how much electricity does one cubic meter of air cost"; only then does comparison mean something.
- Fix the formula: specific energy = total electricity of the compressed air system in the period ÷ cumulative air delivered at the main header; the denominator counts only air that reached the network.
- Compare at two levels: watch plant-wide specific energy for trend, and branch-allocated specific energy per unit; keep the two views apart so they do not interfere.
- Bring it to shifts: compare specific energy by shift and by month, and the effect of handovers and schedule changes becomes directly visible.
- One ruler across retrofits: recalculate with the same formula before and after variable frequency retrofits or leak repairs, so results have a credible comparison.
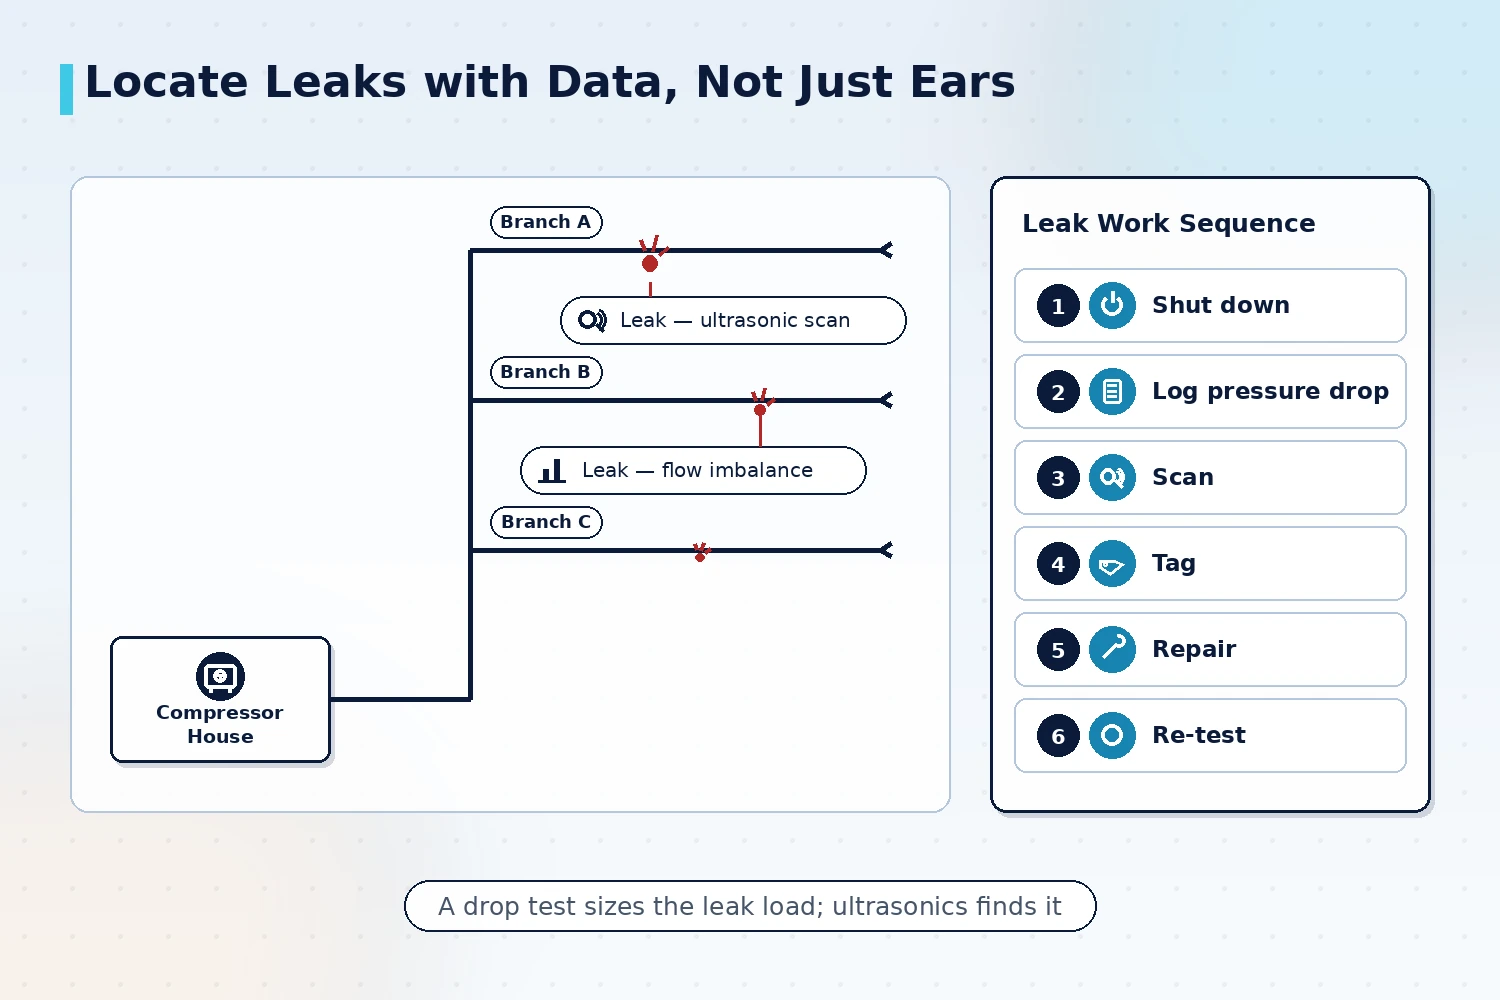
Leak management: from listening to locating with data
Leaks are the most persistent form of waste in a compressed air system, and managing them takes a process rather than a one-off campaign. ISO 11011:2013 provides a general framework for compressed air leak assessment and reporting that can serve directly as the process blueprint.
- Size leaks with data: run a pressure drop test outside production hours and estimate the leak load from the drop rate and main header flow; quantify first, then act.
- Locate with instruments: scan point by point with an ultrasonic leak detector; it covers far more ground than listening by ear, and findings are tagged on the spot.
- Re-test after repairs: repeat the pressure drop test after each repair round and record the change in leak load.
- Make it routine: put leak re-checks on a quarterly or semi-annual schedule; leak management is not a one-time project.
From monitoring to control: alarms and linked actions
Monitoring data only becomes management when it triggers action. Four common scenarios can be set up like this:
| Scenario | Monitoring trigger | Recommended action |
|---|---|---|
| Sudden leak growth | Faster pressure drop outside production hours, or a rising night base flow | Inspect for new leak points and schedule a scan |
| Excessive pressure | Supply pressure stays above what the points of use actually need | Lower pressure setpoints in steps, confirming the effect section by section |
| Long idle running | A single compressor unloads for long stretches | Adjust load/unload strategy or the unit combination and review the number of machines in service |
| Dew point drift | Dew point above the value the process allows | Check dryer regeneration status and purge air use, and schedule maintenance |
Implementation sequence and common pitfalls
A practical sequence has three steps: first use existing instruments to measure main header flow and compressor electricity and form a baseline; then add branch metering by consumer unit and break specific energy down to each unit; finally put leak detection and load/unload strategy reviews into the routine. Three pitfalls are common: installing meters without fixing the calculation basis, so data piles up but specific energy never gets computed; jumping straight to equipment replacement and loading every measure onto capital expenditure; and treating the monitoring platform as the finish line, so alarms go unclaimed and data is never reviewed. For in-house implementation versus engaging an external team, the deciding factors are the instrument and electrical skills on site: teams with their own instrument and electrical staff can complete main-header metering and the baseline themselves, while branch installation and platform build-out are better delegated to a team with energy management delivery experience. ISO 50001:2018, with its requirements on data, baselines and continual review, serves directly as the institutional frame for this monitoring mechanism. Bring your compressor room configuration and speak with our English-speaking contact about the metering layout.
Food, automotive and electronics plants all run compressed air as a common utility, which makes this monitoring approach applicable across general manufacturing.
Summary
Energy management for compressed air does not need to start as a big project: meter the right parameters, place meters at the right points, and compute specific energy correctly; once those three actions are solid, leak management and compressor operation strategy have a data basis to stand on. Connecting monitoring into routine review and re-testing is what makes the improvement last. Shanghai Orpaon Intelligent brings years of implementation and delivery experience in energy management and EMS; you are welcome to bring your site's air consumption and power distribution data and talk through a solution with us.
Request an On-site Diagnosis
Want to know your plant's compressed air specific energy and leak load? Bring your compressor room configuration and recent energy data, and we will arrange an engineer to visit, assess the site, and propose a metering layout with prioritized improvement actions.
Contact Us