CNC Machine Monitoring: Signals, Connectivity and OEE
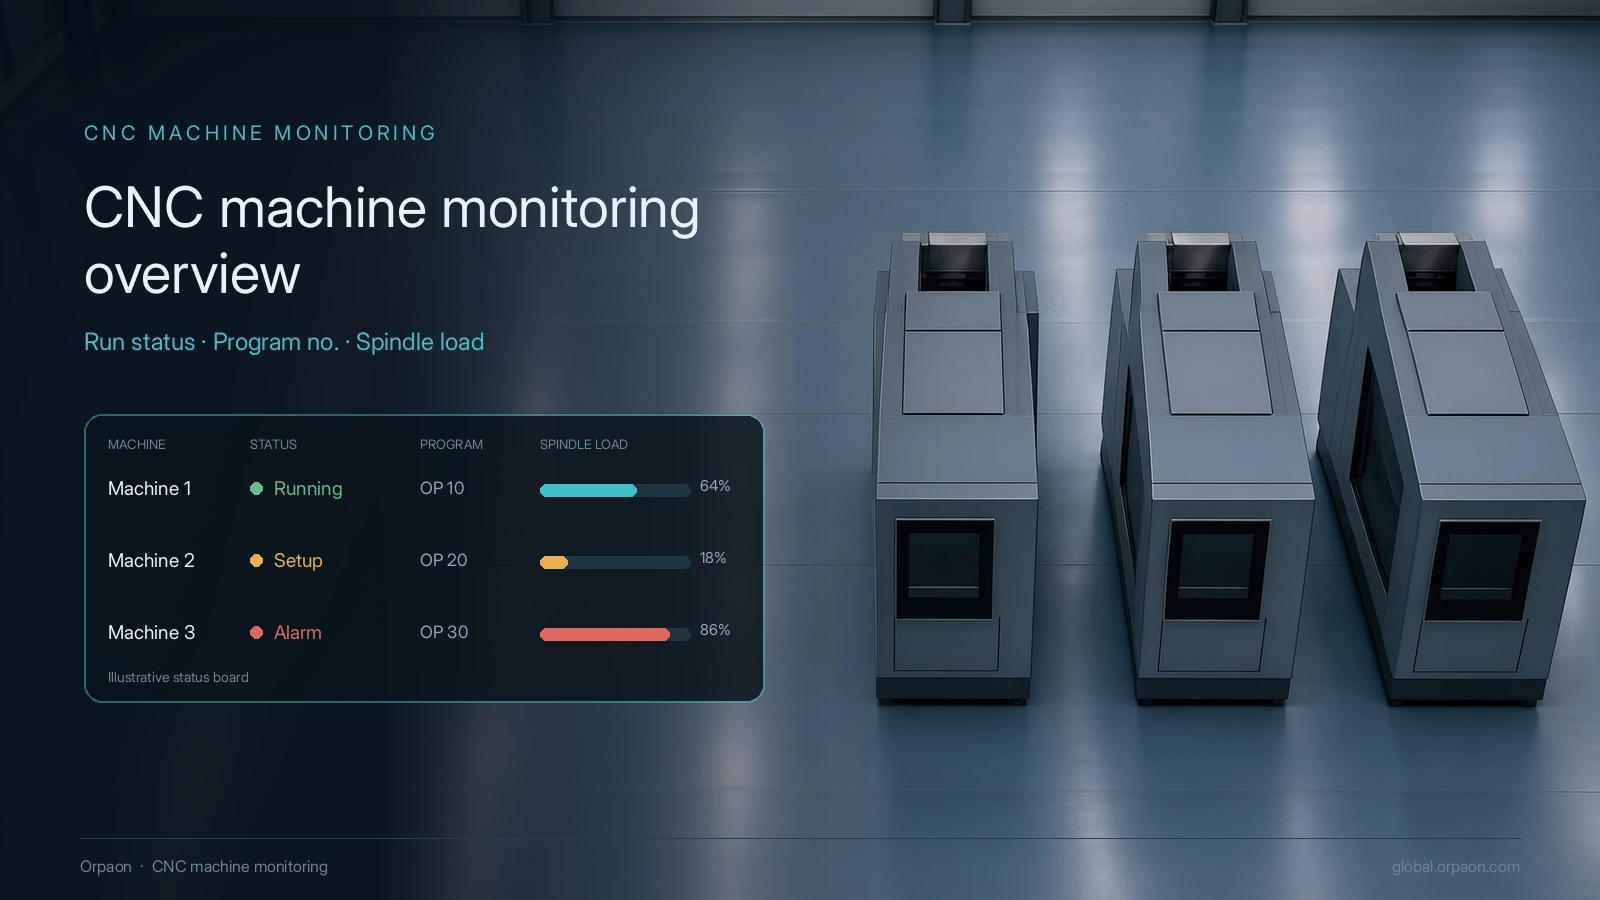
A CNC machine monitoring system collects the controller’s own run status, program number, spindle load and alarm codes, plus tool life and part counts, and turns them into a consistent utilisation and OEE basis. The question it answers is not whether a machine is switched on, but why this machine was down for ninety-seven minutes in the last eight-hour shift and which cause that time belongs to. Connection paths and definitions come before platform selection.
What to collect first
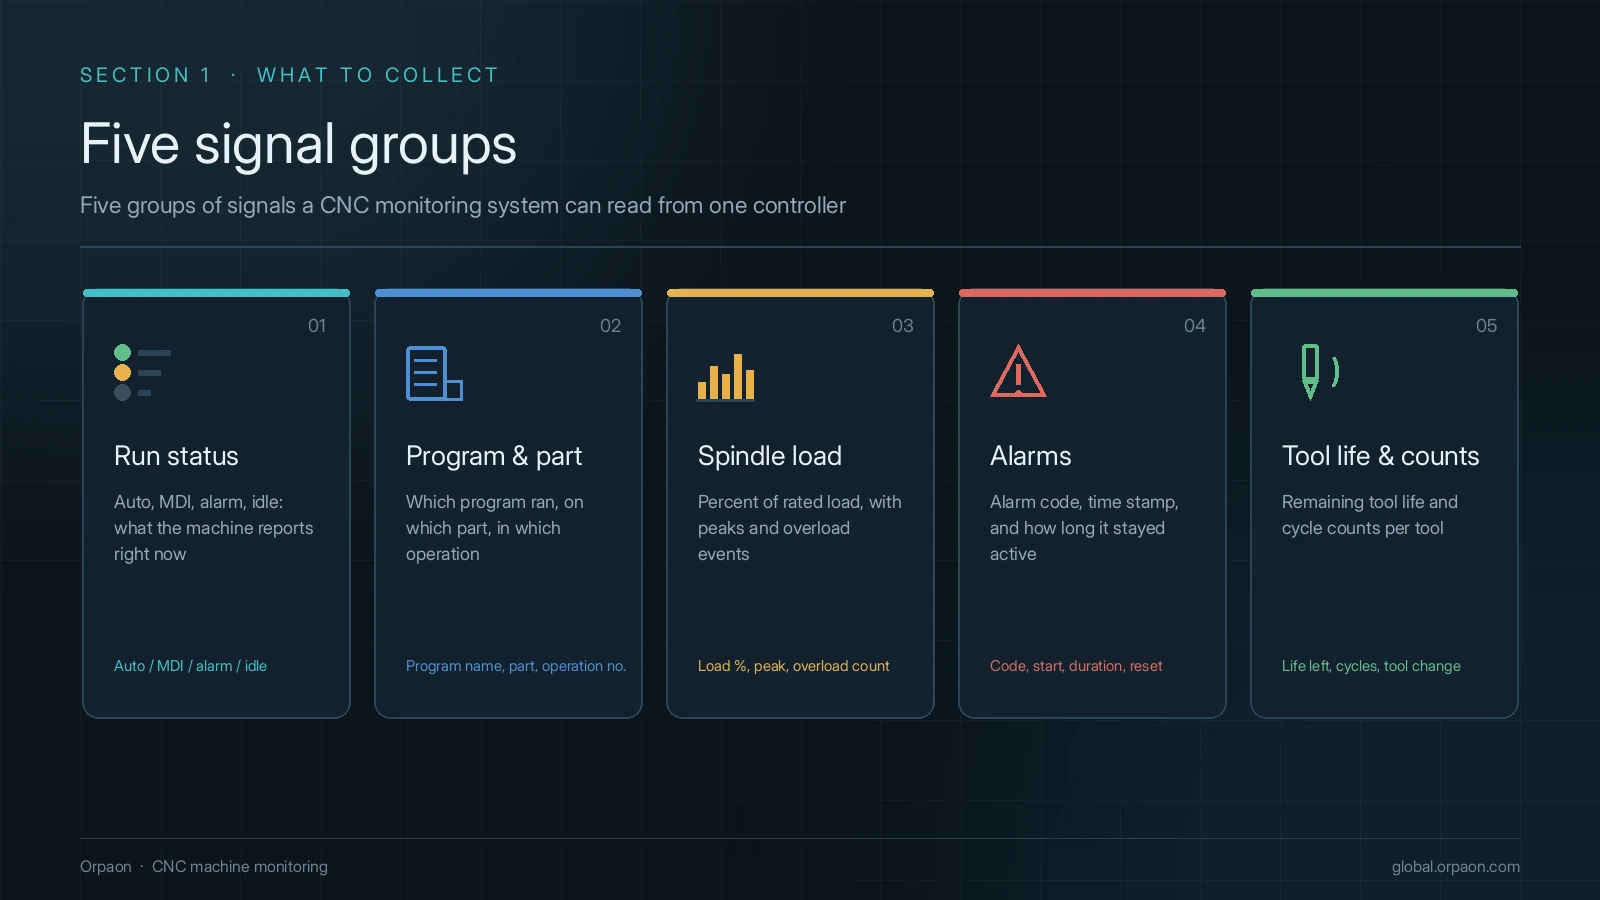
The first step in connecting machines is not choosing a platform, it is fixing the signal list. A machining centre controller exposes several hundred addressable fields, yet five groups carry most of the later analysis: whether the machine is cutting, what it is cutting, how hard, what has raised an alarm, and how much tool life is left. Define those five and the data stays usable even if the platform is replaced later.
- Run status and operating mode: automatic, paused, stopped, alarm, setup, used to split time
- Active program number and workpiece ID: attach the record to a specific program and batch
- Spindle load, feed override and spindle speed: separate idle running, light cuts and abnormal load
- Alarm number and alarm text: group causes into mechanical, electrical, program and operator classes
- Tool life, tool change count and part count: support tool management and cycle time review
How to connect: three paths
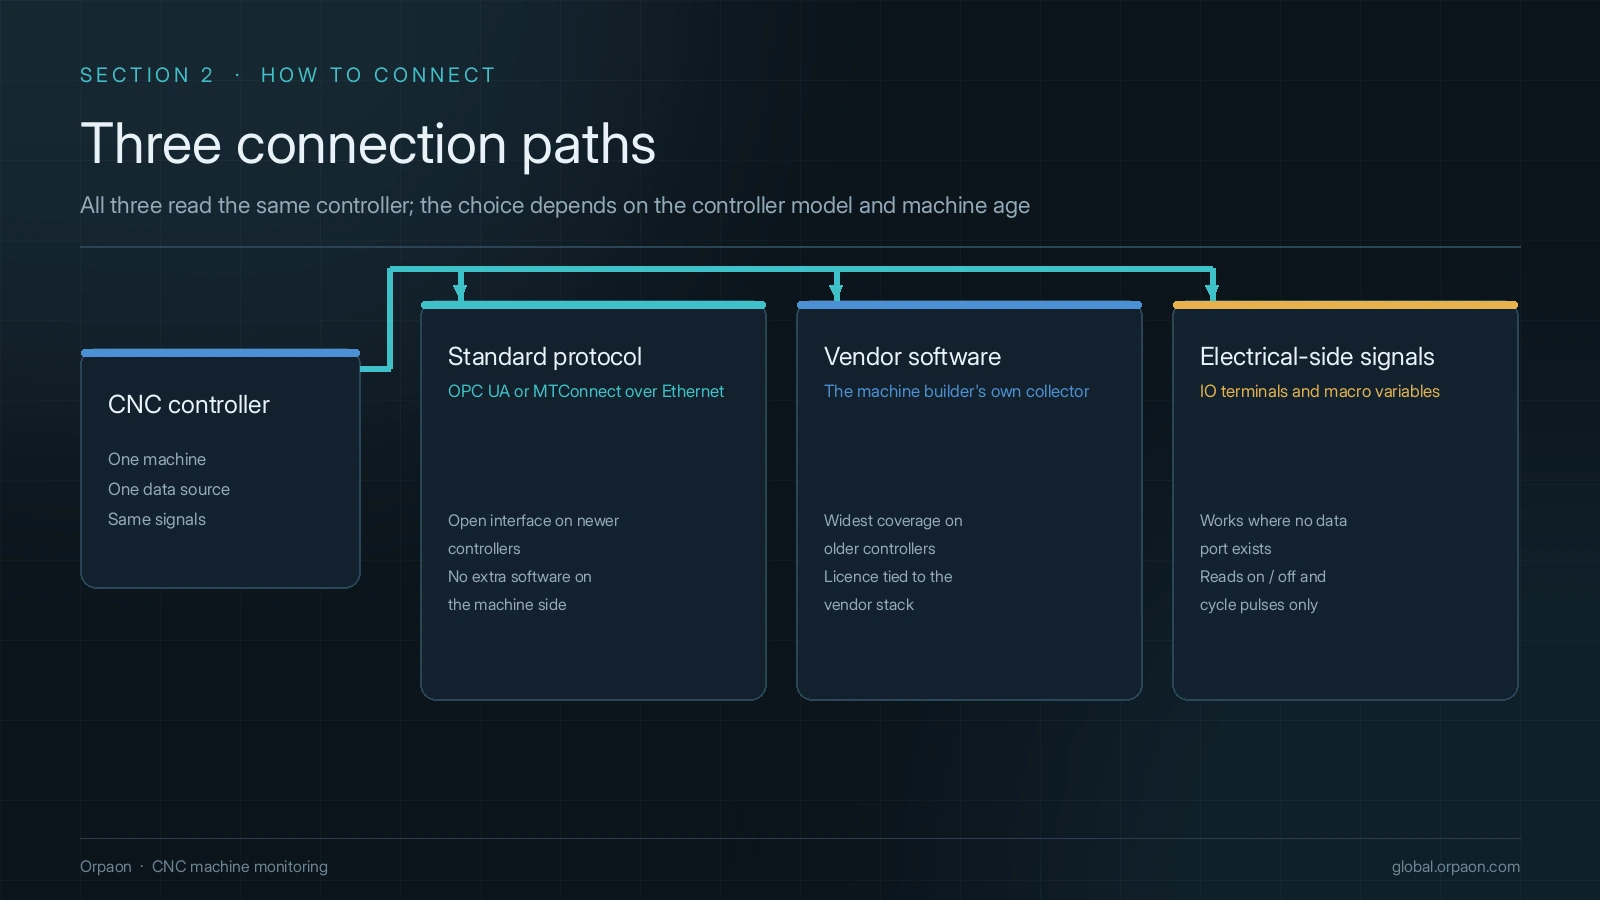
Controllers on one production line usually date from different years. The connection path depends on how open the controller is, not on what the software would like to read. Three layers cover most shops: a standard protocol where the controller offers one, the vendor’s own acquisition software where only that tool can read the data, and electrical-side signals where neither exists.
| Connection path | When it fits | What the machine owner provides |
|---|---|---|
| Standard interfaces such as OPC UA or MTConnect | Controller has Ethernet and an open protocol | Protocol documentation, IP and port plan, access rights |
| Vendor acquisition software or SDK | Controller has an official data service | Licence, list of readable fields, version compatibility |
| Electrical-side signals and macro variables | Older controller with no open interface | Electrical drawings, IO point list, macro variable addresses |
Setting the utilisation and OEE basis
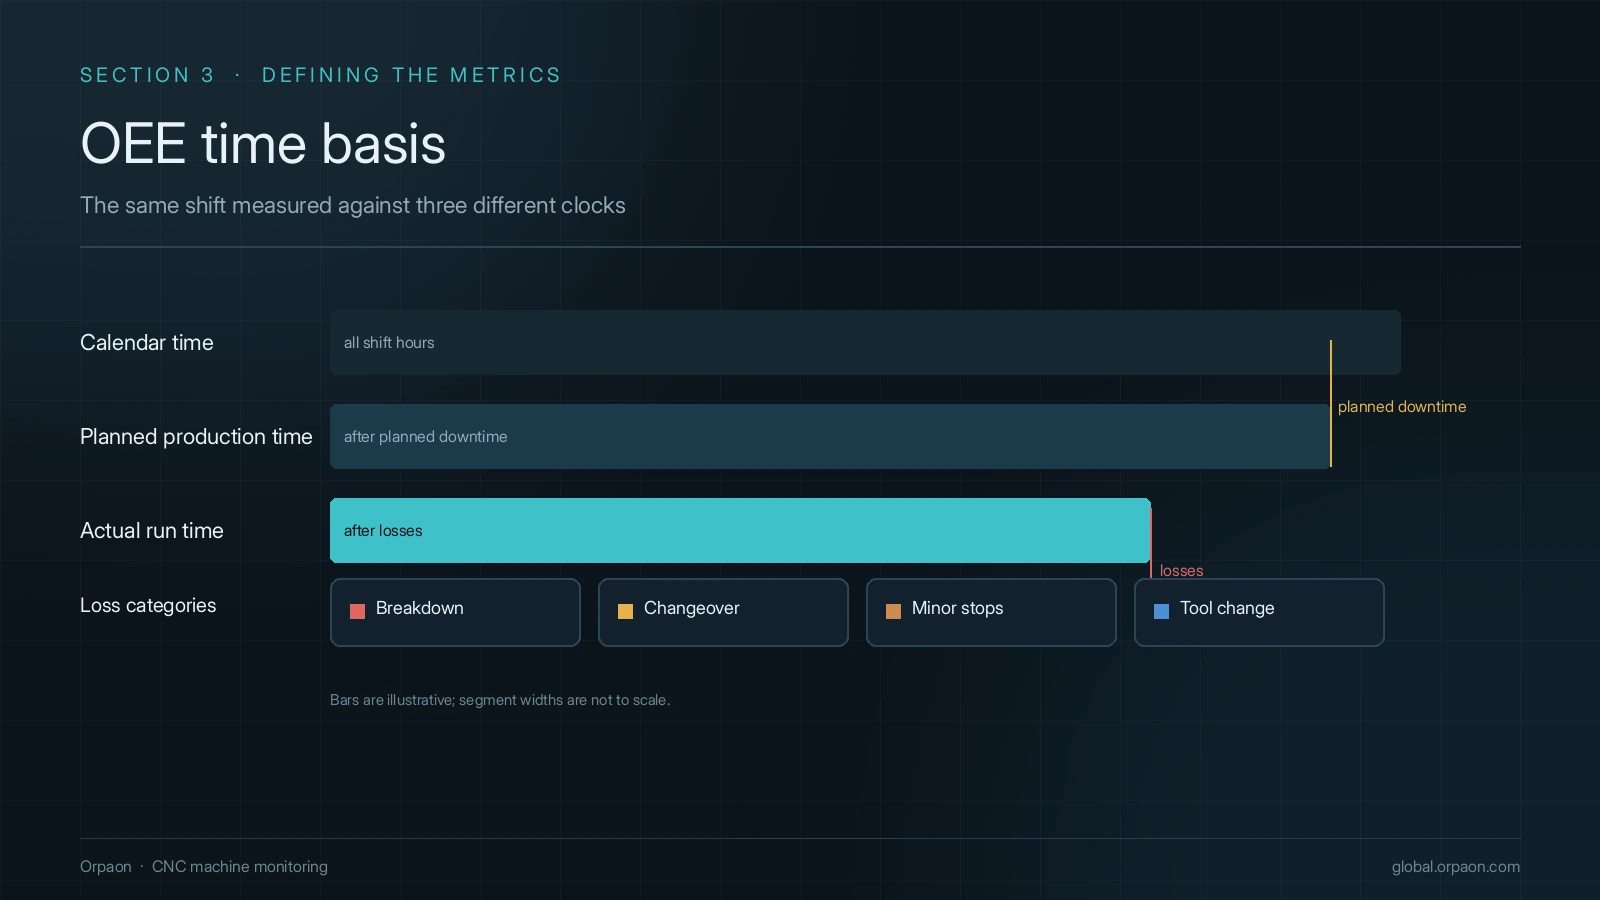
Two departments reporting different utilisation figures is common, and the cause is usually the definition rather than the acquisition. ISO 22400-2:2014 defines the three OEE factors, but it does not decide whether planned downtime counts as loss, where setup time belongs, or whether a tool change stops the machine. The plant has to write those rules down.
The six big losses come from the TPM method published by Seiichi Nakajima in 1988, and on a machining floor they need localising: breakdown, changeover, idling and minor stops, tool change, trial cuts and rework each get the name used on that floor. Agree the definitions before automating, otherwise accurate data only moves the argument onto a screen.
- Put every timestamp on the controller clock and re-synchronise it, so reports do not split shifts by gateway time
- Write status rules as fixed logic: which alarm numbers count as breakdown, which as waiting for material, which as setup
- Have the shift leader confirm the loss mapping once, then review it monthly so one cause does not land in two categories
Acceptance gates before go-live
Machine monitoring projects on machining floors rarely fail because data cannot be collected; they fail because nobody trusts what was collected. Four checks at acceptance are worth more than ten extra machines connected.
- Completeness sampling: pick three shifts at random and compare manual counts with system counts, machine by machine
- Status review: export one day of downtime detail and let the shift leader confirm each classification
- Alarm replay: trace an alarm number back to the program, load and operator record of that moment
- Network loss: unplug the gateway for ten minutes and confirm no missing segment and no timestamp jump after recovery
Summary
The value of machine monitoring is not the number of screens, it is whether the data settles a specific question: why this machine stopped, why this changeover ran over, why this tool was scrapped early. Fix the signal list, the connection path, the definitions and the acceptance checks, and people will use the system. Predictive maintenance and tool life forecasting remain development topics that can be advanced through joint validation, not delivery commitments.
Request an on-site diagnosis
Bring the list of controllers on your floor and the metrics you want to see, and we map the connection path and acceptance checklist to your interfaces.
Contact Us