Automated meter reading data aggregation: the checklist
An automated meter reading and data aggregation system collects readings from electricity, water, gas, heat and steam meters on a fixed cycle, stores them in one database and generates reports automatically, replacing manual meter rounds and spreadsheet transcribing. It addresses three things that otherwise depend on human discipline: timely readings, consistent measurement rules and traceable aggregation. This guide explains how such a system is structured and what to confirm at each stage, in three parts: the meter inventory, data rules and acceptance checks.
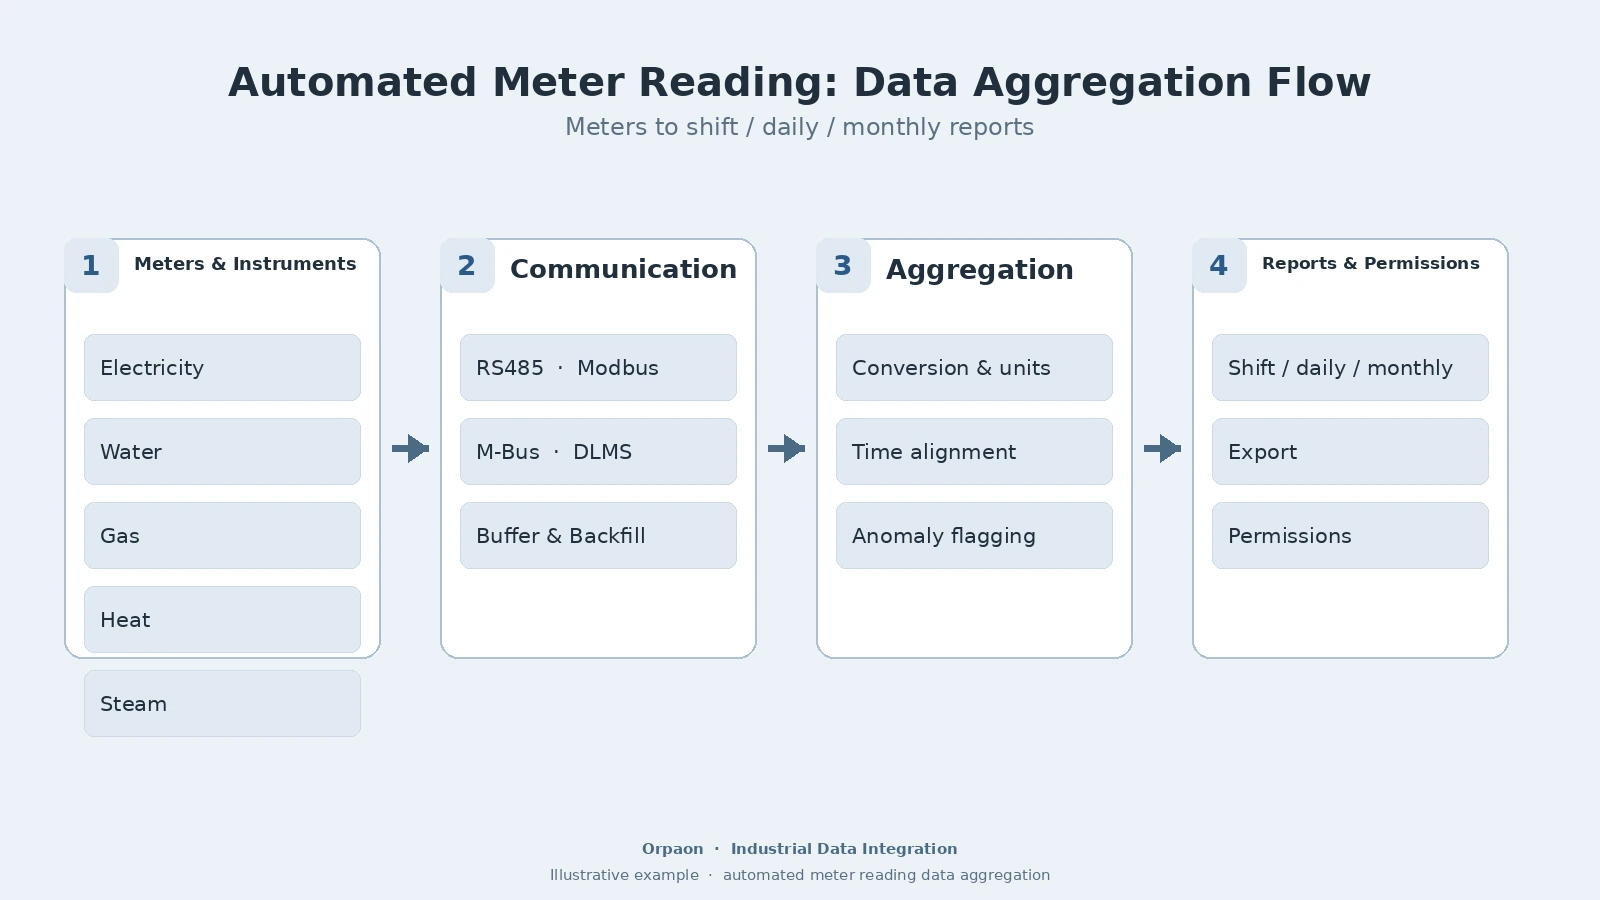
How the aggregation chain works: four stages from meter to report
An aggregation chain that runs reliably over years is usually organized in four stages. The acquisition stage reads raw values from electricity, water, gas, heat and steam meters, supporting common meter interfaces such as RS485, Modbus, M-Bus and DLMS/COSEM (IEC 62056, current edition published in 2021). The communication stage feeds readings to the collection service or platform on a set cycle. The aggregation stage applies conversion factors, unifies units and time alignment, and writes to the database. The application stage produces shift, daily and monthly reports with export, notification and access control.
- Acquisition stage: electrical parameters, water, gas, heat and steam flows connected meter by meter, deciding source data quality
- Communication stage: RS485 bus, Ethernet or wireless channels selected per point condition, with local buffering during outages and backfill after recovery
- Aggregation stage: multiplier and unit conversion, time alignment and abnormal-value flagging, forming a database with unified measurement rules
- Application stage: automatic shift, daily and monthly reports with export, notification and permission control
Two items in the aggregation stage are most often left out of contracts: the conversion rules and the outage backfill behavior. A wrong multiplier distorts a whole month of data, and without an agreed buffering period a single network failure leaves a gap. Both should be written into the technical agreement at the requirements stage.
The meter inventory: connect one category at a time
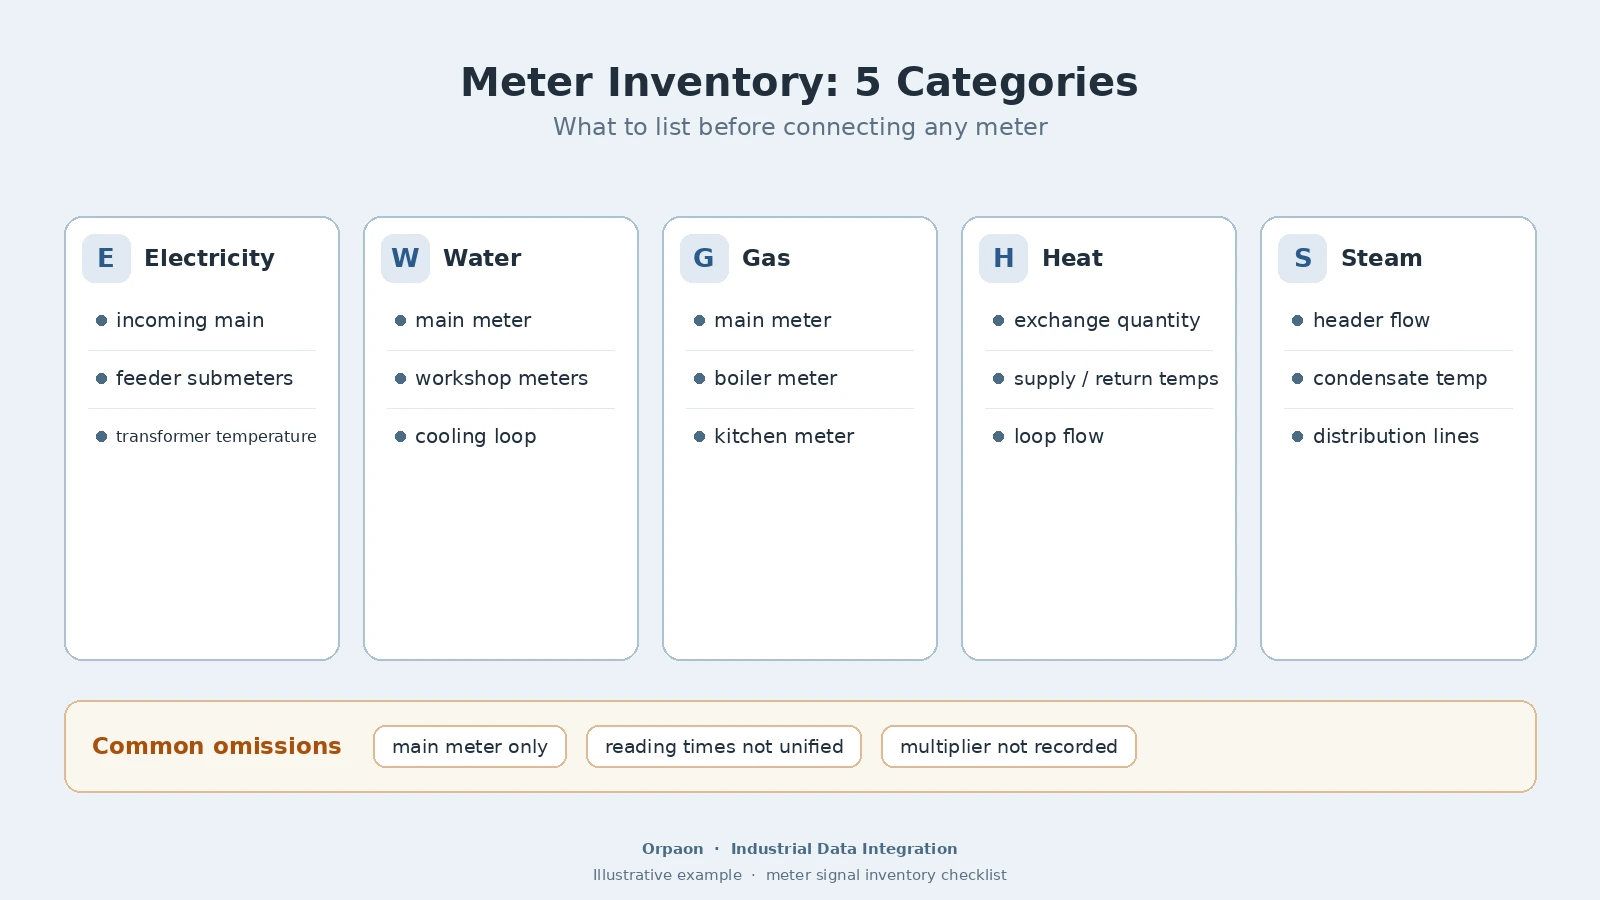
The scale of aggregation is decided by the meter inventory. The method is to divide the plant or building by energy type, list meter points per zone, and fix the interface, multiplier and purpose for each point. The table below lists five meter categories common in manufacturing plants with their typical issues:
| Category | Typical points | Common omissions |
|---|---|---|
| Electricity | incoming main meter, feeder submeters, transformer temperature | only a main meter, so submeters never match shift data |
| Water | main water meter, workshop submeters, cooling-loop meter | reading times not unified, cross-comparison distorted |
| Gas | main gas meter, boiler submeters, kitchen submeters | multipliers and pressure correction not recorded |
| Heat | heat exchange quantity, supply and return temperatures, loop flow | only heat logged without temperatures, anomalies cannot be located |
| Steam | header flow meters, condensate temperature | meter range mismatched to actual operating conditions |
After the inventory is complete, run one ledger reconciliation: compare the system's monthly aggregation against manual ledgers and utility bills item by item, and trace the multiplier and reading time of any point whose difference exceeds the agreed threshold. Switch to system rules only after reconciliation passes, so reports and performance reviews share one basis. ISO 50001:2018 sets explicit requirements on the traceability of energy performance data, and an aggregation chain with unified rules is exactly the data foundation such reviews need.
Acceptance checks: confirm four items before switching
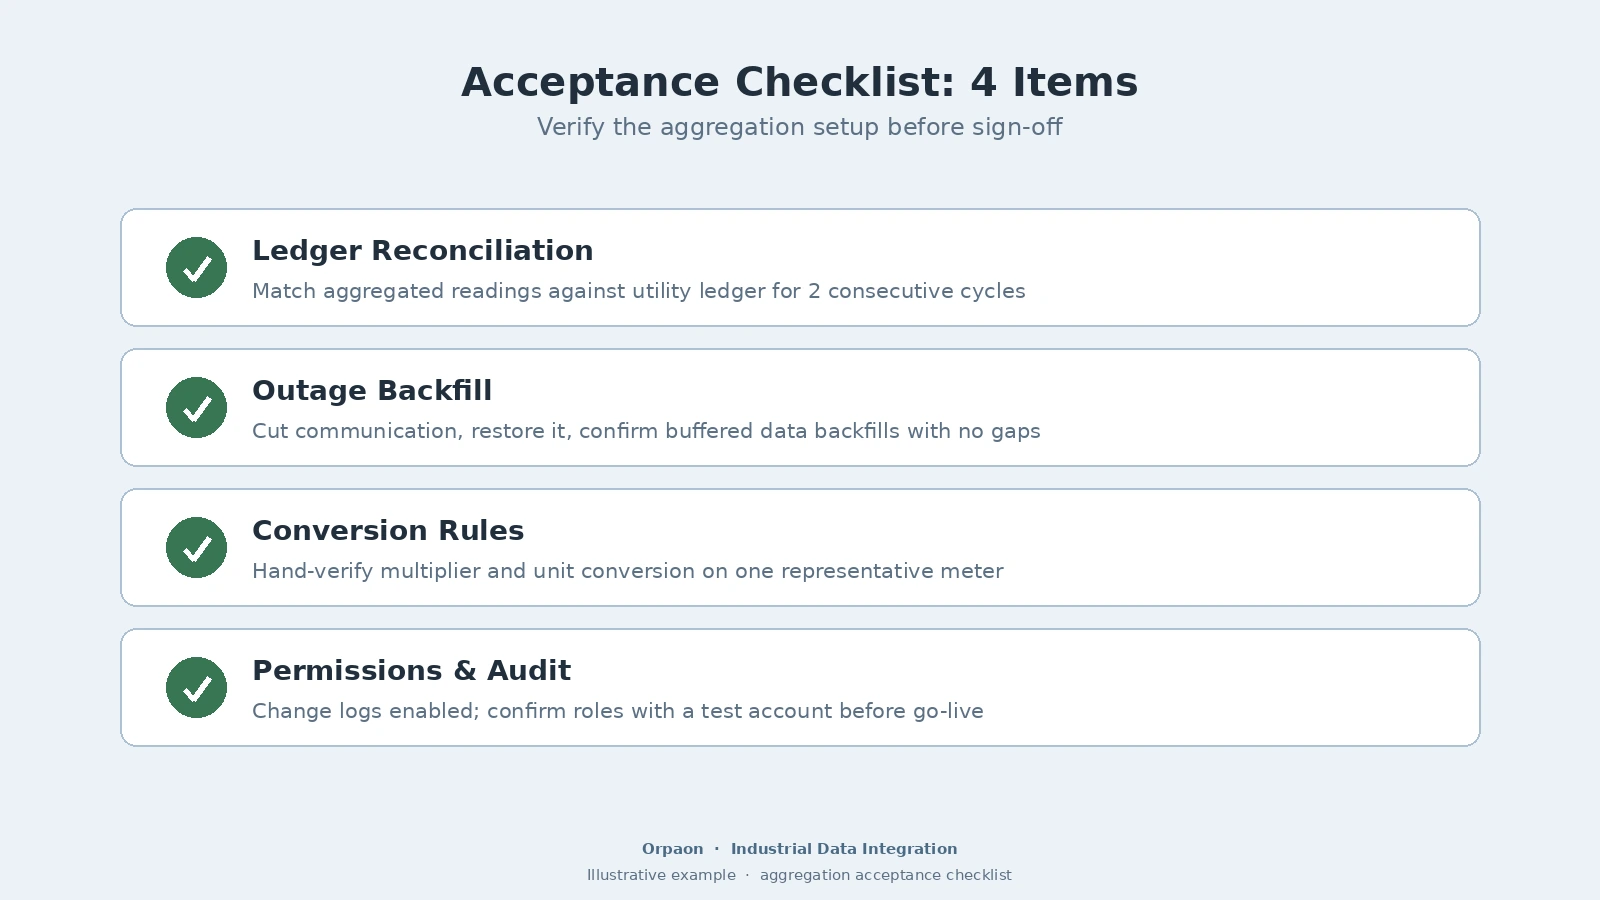
Checking four items before the switch removes most later disputes. Write each into the technical agreement together with its acceptance method:
| Check | What to confirm | Acceptance method |
|---|---|---|
| Ledger reconciliation | difference rate between aggregated values and manual ledgers or bills | compare item by item over two consecutive reading cycles and keep records |
| Outage backfill | buffering duration, backfill behavior after recovery, completeness | cut and restore the link on site; verify backfilled data has no gaps |
| Conversion rules | multipliers, units, time alignment, abnormal-value rules | pick any meter and re-verify once by hand from the raw reading |
| Permissions and audit | change logging, export rights, operation logs | verify change logging and log retrieval with a test account |
Beyond the four items, confirm the vendor's extension path: whether new points can be added from a template, whether historical data can be migrated, and whether platform interfaces are open. Shanghai Chengxuan Intelligence (ORPAON) has worked in industrial data acquisition and monitoring software development since 2009. Its energy management deliveries cover submetering of electricity, water and gas, centralized utility monitoring and benchmarking analysis, with connections to ERP and reporting platforms delivered against a standardized data interface specification. In 2026 it delivered an energy monitoring system with Chinese, English and Japanese interfaces and an OPC UA redundant architecture for an overseas plant; these are historical delivery facts stated as such.
Manual meter reading can remain as a fallback during the transition: switch in batches, run each batch in parallel for one reading cycle, and retire manual rounds for that batch once reconciliation passes. Batch switching surfaces rule problems before they affect reports and gives operators time to get used to the new data source.
Summary
The value of automated meter reading and aggregation lies not in reading faster, but in making readings, rules and aggregation fully traceable. Fix the meter inventory, conversion rules, outage backfill and permission audit in the agreement with acceptance methods, and switch in parallel batches — then energy reports, cost allocation and benchmarking rest on a trustworthy data foundation. For plants with many workshops and energy types, proving the ledger reconciliation first and retiring manual rounds step by step is the low-risk path.
Request a Site Diagnosis
Considering automated meter reading aggregation and energy metering? Submit your meter types, point count and current aggregation method, and an English-speaking contact will propose a meter inventory and a switching path suited to your site.
Contact Us